A common open source approach to observability will begin with databases and visualizations for telemetry - Grafana, Prometheus, Jaeger. But observability doesn’t begin and end here: these tools require configuration, dashboard customization, and may not actually pinpoint the data you need to mitigate system risks.
Coroot was designed to solve the problem of manual, time-consuming observability analysis: it handles the full observability journey — from collecting telemetry to turning it into actionable insights. No code setup thanks to eBPF.
Key Features:
-
eBPF automatically gathers logs, metrics, traces, and profiles
-
Zero-configuration zervice map to grasp a complete at-a-glance picture of your system
-
SLO tracking with custom alerting that compares anomalies to your system’s baseline behaviour
-
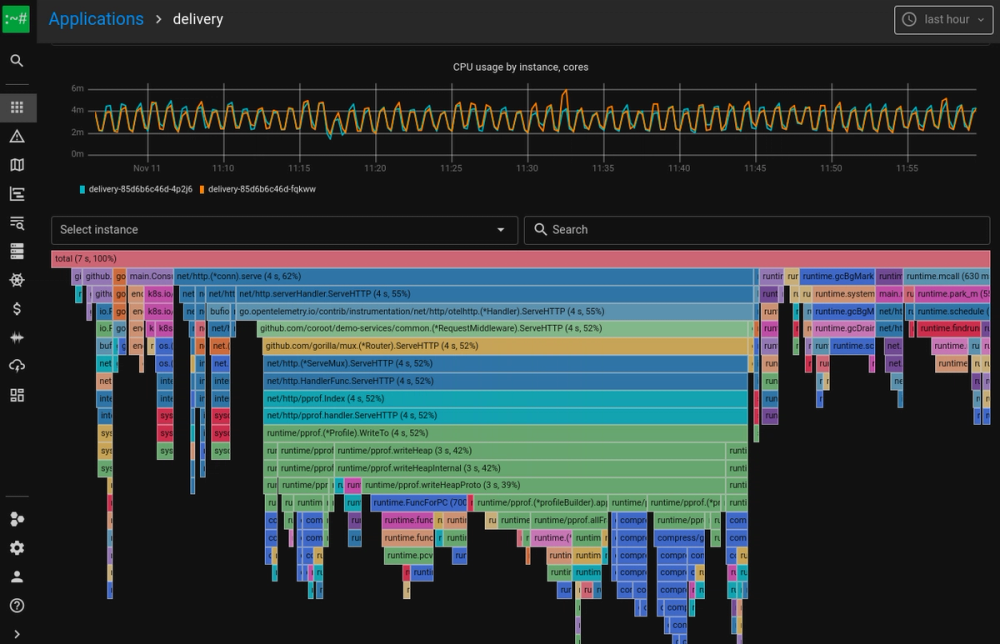
1-click application profiling: see the exact line of code that caused an anomaly
-
Mapped timeframes (stop digging through Grafana to find when the incident occurred)
-
Cost monitoring to track and minimise your cloud expenses (AWS, GCP, Azure)
-
Compatible with kubernetes, VMs, bare metal

