

Who Pulse is for#
Developers Debugging Local Windows Environments
When a build fails, a test suite hangs, or a driver causes intermittent issues, Pulse gives a readable timeline of what Windows was doing in the surrounding minutes. The detail panel exposes raw event XML for cases where the humanized summary is not enough. Searching by provider, process name, or PID narrows events to a specific application.
Skip if:
You are debugging a remote server or a non-Windows machine. Pulse only reads the local Windows Event Log on the machine it runs on.
IT Administrators Generating Support Bundles
The Diagnostics page can package a support bundle (service state, IPC health, pipeline metrics, event export) without requiring the user to leave the application. Reports export as JSON, CSV, HTML, or PDF from preset templates, giving support engineers a clean artifact to work from.
Skip if:
Your organization needs centralized log aggregation across multiple machines. Pulse is a single-machine tool and does not ship log data to a SIEM or log management tool.
Windows Power Users Investigating Crashes and Restarts
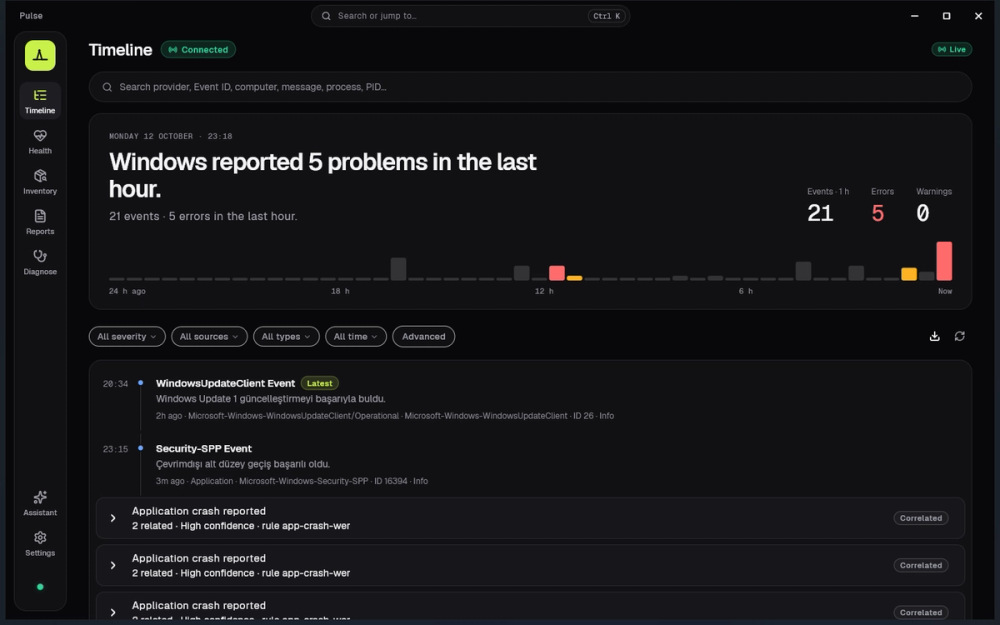
After an unexpected shutdown (Kernel-Power 41) or a recurring application crash (Application Error 1000), Pulse shows the events around that moment in plain language with timeline context. The 24-hour activity strip and incident correlation group related events so the sequence is visible at a glance.
Skip if:
You need real-time alerting sent to Slack, PagerDuty, or email. Pulse sends local Windows system notifications for critical conditions but does not integrate with external alerting pipelines.
Privacy-Conscious Users Who Want Local AI on Their Machine
PulseMCP pairs Pulse's read-only event and health data with a local language model through Ollama or LM Studio. Questions like 'Are there any critical issues?' or 'What is using the most memory?' are answered by a model running entirely on-device. No diagnostic data leaves the PC, and no API key is required.
Skip if:
You do not already run Ollama or LM Studio locally and are not willing to set one up. Pulse's built-in AI features depend on an external local model server; without it, the assistant panel shows as disconnected.
The problem it solves#
Windows generates a detailed record of everything that happens on a machine: crashed applications, service state changes, kernel events, and driver warnings. The problem is that this record lives in Event Viewer, where each entry is an Event ID, an opaque XML payload, and a provider string that requires manual lookup. A sudden restart, a slow boot, or a repeating application crash leaves most users with fragments that are technically accurate but practically unreadable.
The situation worsens when a problem spans multiple sources. Correlating a Kernel-Power 41 with a driver warning and a service failure means toggling between Event Viewer, Device Manager, and PerfMon, each showing one slice of the picture. IT admins and developers already comfortable with these tools still spend real time decoding what Windows is telling them. For everyone else, the data is there but effectively inaccessible.
How it solves it#
Plain-Language Event Timeline
The timeline translates raw Windows Event Log entries into human-readable summaries. 'Application Error Event ID 1000' becomes 'Explorer unexpectedly closed. Windows restarted Explorer.' Each entry shows severity, source, and timestamp, with Explained, Technical, and Raw XML tabs in the detail panel. Live events arrive via EvtSubscribe with no polling delay.
Local AI Assistant via Ollama or LM Studio
PulseMCP connects Pulse's read-only diagnostics to a local language model on your PC. Ask 'Why did my PC restart earlier?' or 'What is using the most memory?' and the assistant queries the same event and health data without sending it to any cloud API. Supported clients include Ollama and LM Studio; Cursor and Claude Desktop can also connect via the MCP bridge.
Live System Health Metrics
System Health tracks CPU, memory, GPU, disk, and network in real time with 60-second sparklines. Metrics use semantic color coding: green for 0-49%, yellow for 50-69%, orange for 70-89%, and red for 90-100%. PDH Processor Utility provides frequency-aware CPU percentage rather than the classic Processor Time counter.
Hardware and Software Inventory
The Inventory view catalogs system hardware (motherboard, BIOS, CPU, memory, storage, network, battery via SMBIOS), connected devices (USB, PCI, audio, displays, Bluetooth), and installed software (programs, drivers, Windows services). Field-level copy and exportable inventory reports are included.
Local Report Export
Reports export as JSON, CSV, HTML, or PDF from four templates: System Health, Timeline, Diagnostics, and inventory catalogs. Exports write to Documents/Pulse/exports by default. No account or upload step is needed; all output stays on the machine.
Background Monitoring and Tray Alerts
Pulse can run in the Windows system tray, monitoring in the background and sending local Windows alerts for critical conditions. The setting persists across sessions without requiring the main window to stay open.
Strengths and trade-offs#
Strengths
- Read-Only by DesignPulse never injects into processes, never hooks the OS, and never patches Windows behavior. The product constitution states 'Observation only. No injection. No hooks. No patches.' and this is enforced at the architecture level: PulseService uses official Windows APIs in read-only mode. Users who worry about monitoring tools interfering with the system they are monitoring have a clear answer here.
- MIT License with No Cloud RequirementThe MIT license means you can run Pulse commercially, modify the source, and redistribute it without restriction. More practically, the entire tool runs on your machine with no account, no sync, and no telemetry. The VirusTotal scan of the installer returned 0 detections across 68 vendors.
- Local AI That Keeps Diagnostic Data On-DeviceThe AI assistant uses Ollama or LM Studio running locally, so diagnostic data never leaves the PC. The PulseMCP bridge exposes read-only tools and resources over the same named pipe as the main app, meaning the model sees only what Pulse already displays. No API key, no cloud model, no data sent to a third party.
- Timeline, Health, Inventory, and Reports in One AppWindows ships Event Viewer, Device Manager, Resource Monitor, and PerfMon as separate tools with separate UIs. Pulse surfaces equivalent data from all four categories in a single app with shared navigation. The Ctrl+K command search spans all views.
Trade-offs
- -Windows-OnlyPulse runs on Windows 10 and Windows 11 only. macOS, Linux, or cross-platform deployment is not supported. The architecture depends on Windows-specific APIs (EvtSubscribe, PDH, DXGI, SetupAPI/SMBIOS), so a non-Windows build would require a fundamentally different backend. Teams running mixed or non-Windows infrastructure need a different tool.
- -PulseService Must Be Installed and RunningThe Flutter app requires PulseService, the C++ Windows service, to be installed and running. A portable ZIP build does not function as a true no-install edition because it does not register the service. The installer handles this automatically, but users on managed machines without admin rights may need IT assistance to install and start the service.
- -Young Project with a Small Contributor BaseThe repository has 145 stars and 4 forks as of its first year. The project is actively maintained (last push October 2026), but the small contributor base means feature velocity depends largely on the primary maintainer. ETW engine support and a plugin system are on the roadmap but not yet implemented.
Pulse vs alternatives#
Pulse vs Windows Event Viewer
Windows Event Viewer is the built-in diagnostic tool every version of Windows ships with. It captures the same data Pulse reads: application crashes, service state changes, kernel events, and driver warnings. The gap is in presentation: Event Viewer surfaces raw Event IDs, XML payloads, and provider strings with no humanization, no live timeline, and no correlation across sources.
Pulse reads from the same Event Log data that Event Viewer exposes and adds a plain-language translation layer, live streaming via EvtSubscribe, severity-based filtering, and an AI assistant that can answer questions about the event history.
| Feature | Pulse | Windows Event Viewer |
|---|---|---|
| License | MIT | Built-in (free) |
| Event translation | Plain-language summaries | Raw Event IDs and XML |
| Live streaming | Yes, via EvtSubscribe | No, manual refresh |
| AI assistant | Yes, local via Ollama/LM Studio | No |
| System health charts | Yes | No |
| Export formats | JSON, CSV, HTML, PDF | EVT/EVTX only |
For routine Windows troubleshooting on a single machine, Pulse replaces the majority of Event Viewer use cases. Event Viewer remains the right choice when you need to clear logs, filter with custom XPath queries, or subscribe to remote event logs on other machines.
Pulse vs Datadog
Datadog is a cloud-based monitoring tool for infrastructure, applications, and logs at scale. It collects metrics and logs from servers, containers, cloud providers, and services, correlating them in a centralized cloud dashboard. The two tools aim at different problems.
| Feature | Pulse | Datadog |
|---|---|---|
| License | MIT | Proprietary |
| Deployment | Local Windows desktop | Cloud plus agent |
| Scope | Single Windows machine | Multi-host, cross-platform |
| Data residency | On-device, no cloud | Datadog cloud |
| AI assistant | Local model via Ollama/LM Studio | Cloud-based |
| Price | Free | Subscription pricing |
Pulse is the right choice when the goal is single-machine Windows diagnostics that stay entirely local, no account is wanted, and data must not leave the PC. Datadog is the right choice when you need monitoring across multiple hosts, cloud infrastructure visibility, APM traces, or alerting pipelines to external services like PagerDuty or Slack.
Quick start#
Install the stable release from GitHub Releases (x64 installer) or clone the repository to build from source using Flutter and CMake.

```powershell
git clone https://github.com/Regncreative/Pulse
.\tools\scripts\run_service_console.ps1
.\tools\scripts\run_app.ps1
```What it's built on#
- Languages
- C++DartTypeScript
- Frameworks
- Flutter
FAQ#
Does Pulse change or affect Windows settings?
No. Pulse is observation-only. It reads the Windows Event Log, system health metrics, and hardware inventory through official Windows APIs. It never injects into processes, patches OS behavior, or hooks system calls. The service runs with the permissions needed to read, not write.
Does Pulse send any data to the internet?
No data leaves the PC. Pulse has no cloud component, no telemetry, no analytics, and no account. Local AI integration uses Ollama or LM Studio running on the same machine. The only outbound action is the one you initiate: exporting a report file to a path you choose.
Does Pulse require a Microsoft account or any sign-in?
No account is required. Preferences persist locally via SharedPreferences, and all features are available without sign-in. The Microsoft Store install path does not require a Pulse account; a Microsoft account is required only by the Store itself, not by Pulse.
What local AI models does Pulse support?
Pulse connects to Ollama or LM Studio running on the same PC. Any model those providers support is usable with the assistant. The PulseMCP bridge exposes read-only diagnostic tools to the model, so it can answer questions about system state without access to unrelated files or network resources.
Is Pulse available for macOS or Linux?
No. Pulse is Windows 10 and Windows 11 only. Its backend service uses Windows-specific APIs (EvtSubscribe, PDH, DXGI, SetupAPI) that have no equivalent cross-platform layer. The project roadmap does not list macOS or Linux as planned targets.
Similar open-source tools#

REA
AI-powered reverse engineering for binaries, apps, and assemblies.

Xray-core
Open source proxy core with XTLS, VLESS, and REALITY protocols

Vela
OpenStreetMap and Google data, no account, no Play Services

Obtainium
Android app updates direct from GitHub and F-Droid

Cloudflare Os
Open source AI workspace with sandboxed apps and Gatekeeper security

OpenShell
Sandboxed runtime for autonomous AI agents, open source by NVIDIA