Open Source Alternatives
  • Alternatives
  • Categories
    Categories by size1,207 projects
    • Developer Tools622
    • AI & Machine Learning524
    • Business & Productivity294
    • Web Development216
    • Security & Monitoring183
    • Communication & Collaboration162
    • IT Management152
    • LLMOps & AI Tooling132
    • Cloud & Hosting130
    • Design & Creative126
    Browse all 21 categoriesProduct & Project Management, DevOps & CI/CD and 9 more
  • Blog
  • Advertise
SearchNotion, Slack, password manager.../
Submit
Open Source Alternatives
  • Alternatives
    • Developer Tools622
    • AI & Machine Learning524
    • Business & Productivity294
    • Web Development216
    • Security & Monitoring183
    • Communication & Collaboration162
    • Browse all 21 categories
  • Blog
  • Advertise
Submit your project

New open source projects by email

The projects we add and every new guide. Free, unsubscribe any time.

Open Source Alternatives LogoOpen Source Alternatives

Handpicked Open Source Alternatives to Paid Softwares

Add Open Source Alternatives as a preferred source on Google

Product

  • Categories
  • Tag
  • Advertise

Resources

  • Blog
  • Collection
  • Submit

Company

  • Privacy Policy
  • Terms of Service
  • Refund Policy
  • Sitemap

Alternatives

  • Claude Code
  • Jira
  • Notion
  • Slack
  • Linear
  • Wispr Flow
  • All alternatives
© 2026 Open Source Alternatives. All rights reserved.
Open SourceAlternatives
Home/Categories/Security & Monitoring/ClickStack
icon of ClickStack

ClickStack

Open source alternative to Datadog, Dynatrace and New Relic

  • 10K stars
  • MIT
  • Active this week
  • Last commit today

Last verified Nov 12, 2026

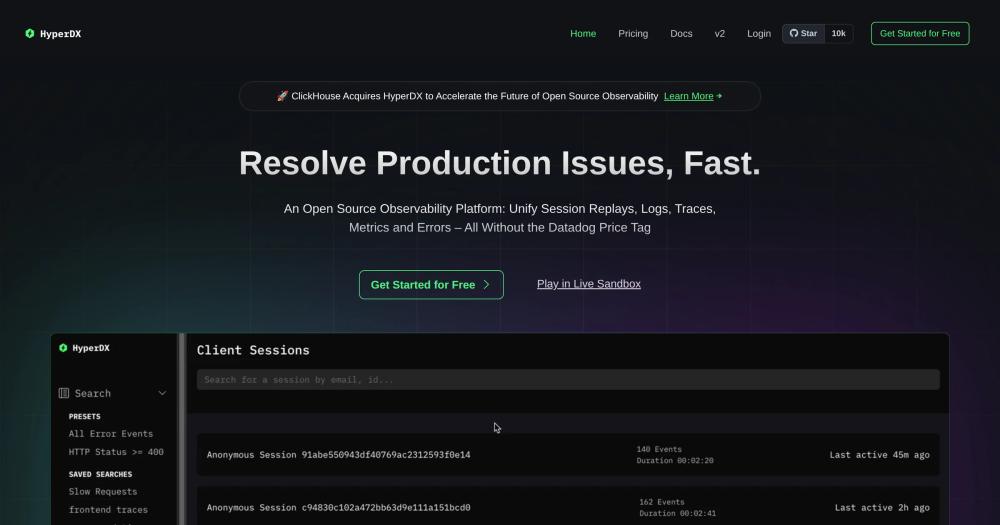
Observe production systems by correlating logs, traces, metrics, session replays, and errors in one open source platform built on ClickHouse.

Visit websiteGitHub10K starsDeploy on Hostinger
image of ClickStack
TL;DR

ClickStack is an open source observability platform that correlates logs, traces, metrics, session replays, and errors in a single interface built on ClickHouse. It replaces commercial tools like Datadog and New Relic, whose per-host and per-seat pricing becomes prohibitive as telemetry volume grows. MIT licensed and self-hosted, it ships as a single Docker image with an OpenTelemetry Collector bundled. Best for engineering teams running high telemetry volumes who want full-stack observability at infrastructure cost rather than SaaS pricing.

Read the full breakdownHide the full breakdownWho it is for, how it works, trade-offs, the quick start and the FAQ
who it's for

Who ClickStack is for#

Engineering teams hitting observability cost limits

Teams spending more on Datadog or New Relic than their actual infrastructure find that ClickStack lets them collect full-fidelity telemetry, without sampling, at the cost of running ClickHouse themselves. The OpenTelemetry-native ingestion means minimal re-instrumentation.

Skip if:

If your team has no one comfortable running and maintaining ClickHouse in production, the operational overhead may offset the billing savings. Managed SaaS tools may be simpler until your team grows that capability.

Full-stack teams debugging cross-service production issues

Teams whose production incidents require correlating what a user did in the browser with what happened on the backend find ClickStack's session-replay-to-trace correlation directly useful. One interface covers the full path from browser event to database query.

Skip if:

If your team only needs server-side log search and has no use for browser session replay or APM, lighter tools cover the core need at lower infrastructure cost.

Teams running OpenTelemetry already

If your stack already emits OTel signals, connecting to ClickStack requires pointing your existing collector at the new endpoint. No new agent, no SDK change. The Docker image bundles the collector, so the entire setup can be a single compose file update.

Skip if:

If you are not yet running OpenTelemetry and your team is small, the instrumentation investment may not be worth it for the observability you need. Simpler log-forwarding setups are easier to start with.

the problem

The problem it solves#

Production observability with commercial tools follows a predictable cost trajectory: more infrastructure means more hosts, more hosts means higher per-host billing, and teams that want to debug effectively end up collecting less data to keep bills manageable. Datadog, Dynatrace, and New Relic all charge in ways that penalize volume, so engineering teams routinely sample aggressively or drop entire signal types to stay within budget.

The second pain is fragmentation. Logs live in one tool, session replays in another, APM traces in a third. When a production issue lands, the debug path requires hopping between surfaces and manually correlating timestamps, user IDs, and trace IDs. This kind of investigation taxes the person doing it and slows resolution. Teams that cannot afford a dedicated SRE to manage the observability stack often reach a point where the tool is consuming more time than the production incidents it is meant to surface.

how ClickStack solves it

How it solves it#

Full-stack signal correlation

Correlates logs, traces, metrics, session replays, and errors in a single query interface. You can start from a user session in the browser, jump to the backend span that handled the request, and filter to the log lines it generated, without switching tools or manually matching timestamps.

ClickHouse-backed search

Searches run directly on ClickHouse, which handles terabytes of event data with sub-second latency. Full-text search, property filters (such as level:err), and native JSON querying work without a separate indexing pipeline or complex query syntax.

Correlated session replay

Records browser sessions and links them automatically to the backend logs and traces generated during that session. Jumping from a user complaint to the exact server-side trace requires one click rather than a manual log search.

OpenTelemetry-native instrumentation

Accepts data from any OpenTelemetry SDK, covering JavaScript, Python, Java, Go, Ruby, PHP, .NET, Elixir, and Rust. Instrument once and point your existing OTel collector at ClickStack without modifying your application code for a new vendor format.

Event pattern clustering

Groups log lines into distinctive clusters by pattern, condensing billions of events into a manageable summary of what is happening. Useful for surfacing recurring error classes without scanning raw output line by line.

Terminal CLI and TUI

The hdx CLI and interactive TUI let engineers search logs, live-tail events, and view trace waterfalls without leaving the terminal. Includes raw SQL queries, NDJSON output, and log pattern mining for scripting and AI agents.

strengths · trade-offs

Strengths and trade-offs#

Strengths

  • MIT license with no per-host or per-seat feesThe entire codebase is MIT licensed. Self-hosting on your own infrastructure means your observability cost scales with your servers, not with the number of hosts, users, or GB ingested. Unlike Datadog or New Relic, there is no bill for collecting more data.
  • ClickHouse performance at scaleClickHouse is built for OLAP workloads on large datasets. ClickStack runs queries over terabytes of logs and traces in seconds rather than minutes, without requiring pre-aggregation or index warm-up. The architecture is a direct response to paid tools whose query latency degrades at high volume.
  • OpenTelemetry-native, no vendor lock-inInstrumentation uses standard OpenTelemetry SDKs. If you outgrow ClickStack or want to send data to a different backend, your instrumentation code stays unchanged. This is different from commercial tools that require proprietary agents or vendor-specific SDKs.
  • Maintained by ClickHouse, with 10,000+ GitHub starsOriginally built as HyperDX (Y Combinator-backed), ClickStack was acquired by ClickHouse, Inc. The project has 10,031 stars on GitHub and receives active development. The acquisition means the upstream ClickHouse team is invested in keeping the integration current.

Trade-offs

  • -Requires at least 4GB RAM and 2 CPU coresThe README specifies at least 4GB of RAM and 2 CPU cores for testing deployments. The all-in-one Docker image bundles ClickHouse, MongoDB, and an OTel collector, so low-resource environments will not have enough headroom. Production deployments require more.
  • -157 open issues at time of indexingThe repository carried 157 open issues when this was written. For a tool that recently changed ownership and was rebranded from HyperDX to ClickStack, some roughness is expected. Active development continues, but teams running this in production should monitor the issue tracker.
  • -Anonymized usage telemetry is on by defaultClickStack collects anonymized usage data from open source deployments. The README documents the opt-out: set the USAGE_STATS_ENABLED environment variable to false. Teams with strict data policies should disable it at deploy time.
versus alternatives

ClickStack vs alternatives#

ClickStack vs Datadog

Datadog is a managed SaaS observability platform covering infrastructure monitoring, APM, logging, and security. ClickStack covers the same signals, including logs, traces, metrics, session replay, and errors, with self-hosted infrastructure on ClickHouse.

FeatureClickStackDatadog
LicenseMITProprietary SaaS
Self-hostingYes, Docker or KubernetesNo (SaaS only)
PricingInfrastructure costPer host, per user, per GB
Session replayYesYes (paid add-on)
OpenTelemetryNativeSupported

ClickStack is the stronger choice for teams whose telemetry volume makes Datadog's per-host and per-GB pricing prohibitive. The MIT license and ClickHouse backend mean you pay for the servers you run, not the data you collect. Datadog is the better fit when your team needs its broad integration catalog, managed security monitoring, or compliance certifications without taking on infrastructure operations.

ClickStack vs New Relic

New Relic uses a consumption-based pricing model that charges per GB of data ingested. ClickStack's self-hosted approach has no ingestion limit beyond your storage capacity.

FeatureClickStackNew Relic
LicenseMITProprietary SaaS
Self-hostingYesNo (SaaS only)
PricingInfrastructure costPer GB ingested
Session replayYesYes
OpenTelemetryNativeSupported

ClickStack is the stronger choice for teams that want to self-host their full observability pipeline and avoid per-volume billing. New Relic remains worth considering when you need AI-driven anomaly detection, a broad integration catalog, or a fully managed service with no infrastructure burden.

ClickStack vs Dynatrace

Dynatrace is an enterprise observability platform that uses AI to automate problem detection and analysis across applications and infrastructure. ClickStack requires explicit OpenTelemetry instrumentation and focuses on correlating signals you configure yourself. Teams in complex enterprise environments where automated problem detection matters often prefer Dynatrace's approach. ClickStack is the better choice for teams that already manage their own instrumentation and want cost-predictable, self-hosted observability storage.
install · quick start

Quick start#

bash
Self-hosting uses Docker with the all-in-one image that bundles ClickHouse, the UI, an OpenTelemetry Collector, and MongoDB.
```bash
docker run -p 8080:8080 -p 4317:4317 -p 4318:4318 docker.clickhouse.com/clickhouse/clickstack-all-in-one
```
tech stack · detected from GitHub

What it's built on#

Languages
JavaScriptTypeScript
Frameworks
ExpressNext.jsReact
Databases
ClickHouseMongoDB
Infrastructure
Kubernetes
frequently asked

FAQ#

Does ClickStack require a ClickHouse instance already?

No. The all-in-one Docker image bundles ClickHouse alongside the ClickStack UI, an OpenTelemetry Collector, and MongoDB. You can run everything with one docker run command and visit localhost:8080. For production, the docs cover options for deploying against an existing ClickHouse cluster or using ClickHouse Cloud.

What languages and platforms can send data to ClickStack?

ClickStack accepts any OpenTelemetry-compatible signal. Directly supported SDKs cover Node.js, Python, Java, Go, Elixir, React Native, and browsers. Any language with an OTel SDK works via the collector. Kubernetes, AWS EC2, Vercel, Fly.io, Heroku, and Cloudflare are listed as supported platforms on the website.

Is ClickStack the same as HyperDX?

Yes. HyperDX was the original name when the project launched. ClickHouse acquired HyperDX and renamed the project ClickStack. The website still runs at hyperdx.io, and the codebase and community Discord carry forward from the HyperDX era. The GitHub repository is at ClickHouse/ClickStack.

Can I opt out of usage data collection?

Yes. ClickStack collects anonymized usage data for open source deployments by default. To opt out, set the USAGE_STATS_ENABLED environment variable to false before starting the container.

How much ClickHouse experience is needed to run ClickStack?

None is needed to get started. The all-in-one Docker image configures ClickHouse internally. The README also notes that ClickStack is schema agnostic and can run on an existing ClickHouse cluster with your own schema. For production deployments at scale, the docs cover options including ClickHouse Cloud.

also worth a look

Similar open-source tools#

Prometheus

Alternative toDatadog

Time series monitoring with a dimensional model and PromQL query language.

  • 67,616 GitHub stars
  • Apache-2.0Licence Apache-2.0

ClawTrace

Alternative toLangSmith

Visualize agent execution trees and track token costs per step

  • 47 GitHub stars
  • Apache-2.0Licence Apache-2.0

Stakpak

Alternative toDatadog

Open source agent that automates app deployment and monitoring

  • 1,855 GitHub stars
  • Apache-2.0Licence Apache-2.0

OpenObserve

Alternative toDatadog

Self-hosted observability for logs, metrics, and traces

  • 22,985 GitHub stars
  • AGPL-3.0Licence AGPL-3.0

Coroot

Alternative toDatadog

Instant observability with no-code setup.

  • 8,009 GitHub stars
  • Apache-2.0Licence Apache-2.0

Grafana

Alternative toDatadog

Open source dashboards for metrics, logs, and traces

  • 77,814 GitHub stars
  • AGPL-3.0Licence AGPL-3.0
by category

Open source tools in these categories#

184

Security & Monitoring

REA (Reverse Engineer Anything), RustDesk, Sherlock
125

DevOps & CI/CD

Nvm, Uptime Kuma, Netdata
623

Developer Tools

Skills for Real Engineers, REA (Reverse Engineer Anything), superpowers
Hostinger

Self-host ClickStack on a Hostinger VPS

Keep it running 24/7, even when your laptop is off. A Hostinger VPS gives it a server of its own.

  1. 01

    Choose a plan

    Starts from $6.49/mo

  2. 02

    Apply

    Extra 10% off yearly plans

  3. 03

    Install ClickStack

    On a server that stays on

  4. 04

    Start building

    Focus on the app, not the server

Deploy on Hostinger

Sponsors

Inbox Zero

Alternative toSuperhuman

AI email assistant that drafts replies and clears your inbox

  • 12,987 GitHub stars
  • AGPL-3.0Licence AGPL-3.0
  • #Email

rakazo

Alternative toGrok Bot

AI teammates you own: your keys, your model, your machine.

  • 7,869 GitHub stars
  • Apache-2.0Licence Apache-2.0
  • #AI Agents

SnitchFeed

Live monitoring on LinkedIn, X, Reddit & more. Agentic social listening for startups.

Marketing & Growth

Advertise your product

New open source projects by email

The projects we add and every new guide. Free, unsubscribe any time.

Find open source alternatives to paid software

/
  • Claude Code to OpenCode
  • Jira to Windshift
  • Notion to AppFlowy
  • Slack to Mattermost
  • Linear to GitLab
  • Wispr Flow to Handy
  • Arc to Zen Browser
  • CapCut to Concat
  • Grok Bot to rakazo
  • Superhuman to Inbox Zero
  • Airtable to AITable
  • Muse to OpenClaw
  • Railway to Coolify
  • GitHub Copilot to Cline
  • Datadog to Netdata
  • Confluence to Wiki.js
  • Microsoft Teams to Rocket.Chat
  • 1Password to KeePassXC
  • Firebase to Supabase
  • Pinecone to Qdrant
  • Zapier to n8n
  • Devin AI to OpenHands
  • Asana to Leantime
  • Contentful to Strapi
  • Claude Code to OpenCode
  • Jira to Windshift
  • Notion to AppFlowy
  • Slack to Mattermost
  • Linear to GitLab
  • Wispr Flow to Handy
  • Arc to Zen Browser
  • CapCut to Concat
  • Grok Bot to rakazo
  • Superhuman to Inbox Zero
  • Airtable to AITable
  • Muse to OpenClaw
  • Railway to Coolify
  • GitHub Copilot to Cline
  • Datadog to Netdata
  • Confluence to Wiki.js
  • Microsoft Teams to Rocket.Chat
  • 1Password to KeePassXC
  • Firebase to Supabase
  • Pinecone to Qdrant
  • Zapier to n8n
  • Devin AI to OpenHands
  • Asana to Leantime
  • Contentful to Strapi