Open Source Alternatives
  • Alternatives
  • Categories
    Categories by size1,215 projects
    • Developer Tools625
    • AI & Machine Learning524
    • Business & Productivity294
    • Web Development216
    • Security & Monitoring188
    • Communication & Collaboration165
    • IT Management154
    • LLMOps & AI Tooling132
    • Cloud & Hosting130
    • DevOps & CI/CD129
    Browse all 21 categoriesDesign & Creative, Product & Project Management and 9 more
  • Blog
  • Advertise
SearchNotion, Slack, password manager.../
Submit
Open Source Alternatives
  • Alternatives
    • Developer Tools625
    • AI & Machine Learning524
    • Business & Productivity294
    • Web Development216
    • Security & Monitoring188
    • Communication & Collaboration165
    • Browse all 21 categories
  • Blog
  • Advertise
Submit your project

New open source projects by email

The projects we add and every new guide. Free, unsubscribe any time.

Open Source Alternatives LogoOpen Source Alternatives

Handpicked Open Source Alternatives to Paid Softwares

Add Open Source Alternatives as a preferred source on Google

Product

  • Categories
  • Tag
  • Advertise

Resources

  • Blog
  • Collection
  • Submit

Company

  • Privacy Policy
  • Terms of Service
  • Refund Policy
  • Sitemap

Alternatives

  • Claude Code
  • Jira
  • Notion
  • Slack
  • Linear
  • Wispr Flow
  • All alternatives
© 2026 Open Source Alternatives. All rights reserved.
Open SourceAlternatives
Home/Categories/Security & Monitoring/Uptrace
icon of Uptrace

Uptrace

Open source alternative to Datadog, New Relic, Honeycomb, Dynatrace and Elastic Observability

  • 4.3K stars
  • AGPL-3.0
  • Active this month
  • Last commit 21 days ago

Last verified Nov 12, 2026

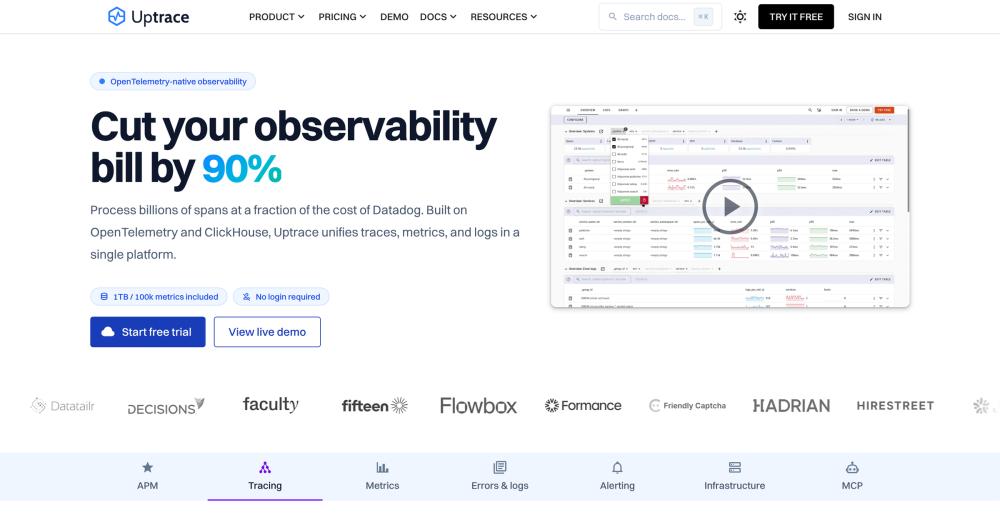
Monitor distributed systems with unified traces, metrics, and logs on a self-hosted APM built on OpenTelemetry and ClickHouse.

Visit websiteGitHub4.3K starsDeploy on Hostinger
image of Uptrace
TL;DR

Uptrace is an open source APM that collects and correlates traces, metrics, and logs in one interface, replacing paid observability tools like Datadog and New Relic for teams that prefer to own their infrastructure. Built on OpenTelemetry and ClickHouse, it handles over 10,000 spans per second on a single core, with 1 KB spans compressed to roughly 40 bytes on disk. Licensed under AGPL-3.0, it deploys via Docker Compose and supports SSO, alerting, and 50+ pre-built dashboards. Best fit for DevOps and platform engineering teams running microservices who need full-stack observability without per-host or per-seat pricing.

Read the full breakdownHide the full breakdownWho it is for, how it works, trade-offs, the quick start and the FAQ
who it's for

Who Uptrace is for#

DevOps teams reducing Datadog costs

Teams currently paying Datadog per-host fees can self-host Uptrace against the same OpenTelemetry instrumentation. No re-instrumentation is required; redirect your OTLP exporter endpoint and start querying in Uptrace's interface.

Skip if:

Your team has no experience managing Docker or cloud infrastructure. Uptrace's self-hosted path requires operating ClickHouse and PostgreSQL, so teams without infrastructure experience will face a steeper ramp than staying with a managed service.

Platform engineers building an internal observability platform

Uptrace's project isolation, YAML-based user management, SSO, and multi-tenancy make it a reasonable foundation for an internal observability platform serving multiple teams. The PromQL and SQL query interfaces are familiar to engineers who already use Prometheus and ClickHouse.

Skip if:

Your organization needs SLA-backed support or audit-trail compliance features beyond what an open source self-hosted tool provides.

Startups with high trace volume and cost pressure

The ClickHouse storage layer and compression ratios mean storage costs scale slowly with data volume. Teams generating millions of spans per day but running cost-conscious infrastructure can self-host without worrying about ingest fees.

Skip if:

Your team is under five engineers and nobody has Docker and Linux server experience. Uptrace's operational overhead is a real cost; at very small team sizes, a managed observability free tier may be more practical.

the problem

The problem it solves#

Commercial observability platforms like Datadog, New Relic, and Honeycomb charge per host, per ingest volume, or per seat, and teams running microservices can spend several thousand dollars per month just to stay visible in production. The costs scale unpredictably with traffic spikes, and proprietary data formats make switching vendors expensive once locked in.

The underlying challenge is that traces, metrics, and logs need to be correlated together to debug distributed systems effectively, but most commercial tools store each signal type separately and charge for each one. OpenTelemetry standardizes collection, but most teams are still paying commercial backends for storage and query on top of it.

how Uptrace solves it

How it solves it#

Unified trace, metric, and log collection

Collects all three signal types in one platform using OpenTelemetry. Traces use a SQL-like query language for grouping and aggregation; metrics use PromQL-compatible queries; logs support JSON and key-value pairs and are automatically linked to their associated traces.

ClickHouse-backed storage and querying

Stores all telemetry data in ClickHouse, an analytical database optimized for time-series workloads. The README documents throughput of over 10,000 spans per second on a single core, with 1 KB spans compressed to roughly 40 bytes on disk. Sub-second queries run over billions of spans on a single node.

50+ pre-built dashboards

Ships dashboards that activate automatically as metrics start arriving. Covers common infrastructure components, Kubernetes, databases, and service graphs with annotation support, so there is no dashboard-from-scratch work for standard setups.

Multi-channel alerting with PromQL and SQL rules

Alert rules support both PromQL expressions for metrics and SQL-based conditions for spans. Notifications go out via Email, Slack, Microsoft Teams, PagerDuty, and AlertManager. Pre-built alert templates cover common failure scenarios.

SSO and multi-tenancy for teams

Supports single sign-on through OpenID Connect with Keycloak, Google Cloud, and Cloudflare. Project isolation and YAML-based user management let platform teams separate environments. Role-based access control is included.

Broad ingestion compatibility

Accepts data from OpenTelemetry exporters, Prometheus scrape endpoints, Vector, FluentBit, and AWS CloudWatch. Compatible with Grafana as a Tempo and Prometheus datasource, so teams can keep existing dashboards while moving storage to Uptrace.

strengths · trade-offs

Strengths and trade-offs#

Strengths

  • No per-seat or per-ingest pricing on self-hostedRunning the self-hosted path has no licensing fees tied to hosts, seats, or data volume. Once deployed, your storage cost scales with your ClickHouse nodes, not with a vendor's billing formula. This makes cost predictable even during traffic spikes.
  • OpenTelemetry-native designBuilt entirely around OpenTelemetry rather than a proprietary agent. This means your instrumentation is vendor-portable: switching away from Uptrace does not require re-instrumenting your services, because the data you send is standard OTEL format readable by any OTel-compatible backend.
  • High-throughput ClickHouse storageClickHouse gives Uptrace analytical query performance uncommon in self-hosted APM tools. The README documents 10,000+ spans per second on a single core and compression that brings 1 KB spans down to roughly 40 bytes, giving predictable storage costs even at scale.
  • Active, recent development4,311 GitHub stars, last pushed October 2026, and an AGPL-3.0 codebase with 40 open issues. The project is not archived and shows recent commit activity, with both a self-hosted and a cloud-managed tier maintained in parallel.

Trade-offs

  • -AGPL-3.0 restricts managed service resaleAGPL-3.0 is an OSI-approved open source license that permits self-hosting, internal commercial use, and modification. If you run a modified version of Uptrace as a hosted service for third parties, you must release those modifications under AGPL-3.0. Teams using Uptrace for internal observability have no restrictions under this license.
  • -Requires ClickHouse and PostgreSQLSelf-hosting Uptrace means managing two separate databases in addition to the Uptrace service itself. ClickHouse is a heavyweight analytical database with its own operational requirements. Teams without ClickHouse experience will need to learn its deployment and tuning before going to production.
  • -40 open GitHub issuesThe project has 40 open issues (from GitHub's API, excluding pull requests). Users running edge-case configurations or specific integrations should check the issue tracker before deploying to production.
versus alternatives

Uptrace vs alternatives#

Uptrace vs Datadog

Datadog and Uptrace cover the same three observability signals: traces, metrics, and logs. The fundamental difference is deployment model and pricing. Datadog is a fully managed SaaS platform with per-host billing, per-seat licensing for some features, and no self-hosted option. Uptrace is AGPL-3.0 open source and self-hosted.

FeatureUptraceDatadog
LicenseAGPL-3.0Proprietary SaaS
Self-hostingYes (Docker Compose)No
Pricing modelInfrastructure cost onlyPer-host / per-seat
Data collectionOpenTelemetry nativeProprietary agent + OTLP

Uptrace is the better fit when cost predictability and data ownership matter more than managed infrastructure. Teams generating millions of spans per day will find Uptrace's ClickHouse compression gives them far more predictable storage costs than Datadog's ingest-based pricing. Datadog remains the stronger choice when your team needs its AI-powered anomaly detection, AWS integration depth, or a no-ops observability path with SLA-backed uptime guarantees.

Uptrace vs New Relic

New Relic moved to a consumption-based pricing model that charges by ingest volume, with a free tier capped at 100 GB per month. Uptrace has no ingest caps on the self-hosted path. Both tools support OpenTelemetry natively, so switching requires minimal re-instrumentation.

FeatureUptraceNew Relic
LicenseAGPL-3.0Proprietary SaaS
Self-hostingYesNo
Free tierUnlimited (self-hosted)100 GB/month
OTel supportNativeNative

Uptrace is the better fit when your data volume would exceed New Relic's free tier regularly, or when regulatory requirements prevent sending telemetry data to a third-party SaaS. New Relic is worth considering when you want an end-to-end managed service with a broad integration catalog, mobile monitoring, and synthetic testing without infrastructure management.

Uptrace vs Honeycomb

Honeycomb specializes in high-cardinality distributed tracing with its BubbleUp and Query Builder tooling. Uptrace covers traces plus metrics and logs; Honeycomb focuses more narrowly on trace analysis. Both are OpenTelemetry-native.

Uptrace is the better fit when you need unified traces, metrics, and logs in one self-hosted tool without per-event billing. Honeycomb is worth considering when your primary need is deep trace analysis with Honeycomb's structured query and anomaly detection tools, and you prefer a managed service over infrastructure management.


install · quick start

Quick start#

bash
Deploy Uptrace with Docker using the official Docker Compose setup that bundles ClickHouse and PostgreSQL.

```bash
git clone https://github.com/uptrace/uptrace.git
docker compose -f uptrace/example/docker/docker-compose.yml up
```
tech stack · detected from GitHub

What it's built on#

Languages
GoTypeScript
Frameworks
DjangoExpressVue
Databases
ClickHouse
frequently asked

FAQ#

Does Uptrace require a cloud account to use?

No. Uptrace is self-hostable and runs entirely on your own infrastructure. There is also an Uptrace Cloud managed service with a free tier (1 TB storage and 100,000 timeseries), but the self-hosted path has no dependency on Uptrace's servers or account system.

What databases does Uptrace require for self-hosting?

Self-hosting Uptrace requires ClickHouse (for traces, metrics, and logs) and PostgreSQL (for metadata such as user accounts, projects, and alert rules). Both are open source databases. The official Docker Compose example in the repository includes both.

Does Uptrace work with existing Prometheus metrics?

Yes. Uptrace accepts Prometheus remote write, so existing Prometheus exporters can forward metrics directly. It also supports Grafana as a data source (compatible with the Tempo and Prometheus datasource formats), so existing Grafana dashboards continue working while Uptrace handles storage and querying.

What can I do with the AGPL-3.0 license?

AGPL-3.0 is an OSI-approved open source license. You can run Uptrace on your own servers at any scale, modify it, and use it commercially for internal observability without paying licensing fees. The restriction applies if you run a modified version as a managed service for third parties: you must then release those modifications under AGPL. Internal use, including at large commercial organizations, is unrestricted.

Can I use Uptrace with existing Grafana dashboards?

Yes. Uptrace is compatible with Grafana as a Tempo datasource for traces and a Prometheus datasource for metrics. Teams can keep their existing Grafana dashboards and point them at Uptrace instead of their current backends. This makes it possible to migrate storage without rebuilding visualization setups.

also worth a look

Similar open-source tools#

Apache SkyWalking

Alternative toDatadog

APM platform covering traces, metrics, logs, and AI agent monitoring.

  • 25,004 GitHub stars
  • Apache-2.0Licence Apache-2.0

Checkmk

Alternative toDatadog

Hybrid IT monitoring with auto-discovery and 2,000+ integrations.

  • 2,643 GitHub stars
  • GPL-2.0Licence GPL-2.0

ClickStack

Alternative toDatadog

Self-hosted observability stack on ClickHouse with session replay

  • 10,031 GitHub stars
  • MITLicence MIT

Prometheus

Alternative toDatadog

Time series monitoring with a dimensional model and PromQL query language.

  • 67,616 GitHub stars
  • Apache-2.0Licence Apache-2.0

ClawTrace

Alternative toLangSmith

Visualize agent execution trees and track token costs per step

  • 47 GitHub stars
  • Apache-2.0Licence Apache-2.0

Stakpak

Alternative toDatadog

Open source agent that automates app deployment and monitoring

  • 1,855 GitHub stars
  • Apache-2.0Licence Apache-2.0
by category

Open source tools in these categories#

188

Security & Monitoring

REA (Reverse Engineer Anything), RustDesk, Sherlock
129

DevOps & CI/CD

Nvm, Uptime Kuma, Netdata
625

Developer Tools

Skills for Real Engineers, REA (Reverse Engineer Anything), superpowers
Hostinger

Self-host Uptrace on a Hostinger VPS

Keep it running 24/7, even when your laptop is off. A Hostinger VPS gives it a server of its own.

  1. 01

    Choose a plan

    Starts from $6.49/mo

  2. 02

    Apply

    Extra 10% off yearly plans

  3. 03

    Install Uptrace

    On a server that stays on

  4. 04

    Start building

    Focus on the app, not the server

Deploy on Hostinger

Sponsors

Inbox Zero

Alternative toSuperhuman

AI email assistant that drafts replies and clears your inbox

  • 12,987 GitHub stars
  • AGPL-3.0Licence AGPL-3.0
  • #Email

rakazo

Alternative toGrok Bot

AI teammates you own: your keys, your model, your machine.

  • 7,869 GitHub stars
  • Apache-2.0Licence Apache-2.0
  • #AI Agents

SnitchFeed

Live monitoring on LinkedIn, X, Reddit & more. Agentic social listening for startups.

Marketing & Growth

Advertise your product

New open source projects by email

The projects we add and every new guide. Free, unsubscribe any time.

Find open source alternatives to paid software

/
  • Claude Code to OpenCode
  • Jira to Windshift
  • Notion to AppFlowy
  • Slack to Mattermost
  • Linear to GitLab
  • Wispr Flow to Handy
  • Arc to Zen Browser
  • CapCut to Concat
  • Grok Bot to rakazo
  • Superhuman to Inbox Zero
  • Airtable to AITable
  • Muse to OpenClaw
  • Railway to Coolify
  • GitHub Copilot to Cline
  • Datadog to Netdata
  • Confluence to Wiki.js
  • Discord to Fluxer
  • Microsoft Teams to Rocket.Chat
  • 1Password to KeePassXC
  • Firebase to Supabase
  • Pinecone to Qdrant
  • Zapier to n8n
  • Devin AI to OpenHands
  • Asana to Leantime
  • Claude Code to OpenCode
  • Jira to Windshift
  • Notion to AppFlowy
  • Slack to Mattermost
  • Linear to GitLab
  • Wispr Flow to Handy
  • Arc to Zen Browser
  • CapCut to Concat
  • Grok Bot to rakazo
  • Superhuman to Inbox Zero
  • Airtable to AITable
  • Muse to OpenClaw
  • Railway to Coolify
  • GitHub Copilot to Cline
  • Datadog to Netdata
  • Confluence to Wiki.js
  • Discord to Fluxer
  • Microsoft Teams to Rocket.Chat
  • 1Password to KeePassXC
  • Firebase to Supabase
  • Pinecone to Qdrant
  • Zapier to n8n
  • Devin AI to OpenHands
  • Asana to Leantime