Open Source Alternatives
  • Alternatives
  • Categories
    Categories by size1,215 projects
    • Developer Tools625
    • AI & Machine Learning524
    • Business & Productivity294
    • Web Development216
    • Security & Monitoring188
    • Communication & Collaboration165
    • IT Management154
    • LLMOps & AI Tooling132
    • Cloud & Hosting130
    • DevOps & CI/CD129
    Browse all 21 categoriesDesign & Creative, Product & Project Management and 9 more
  • Blog
  • Advertise
SearchNotion, Slack, password manager.../
Submit
Open Source Alternatives
  • Alternatives
    • Developer Tools625
    • AI & Machine Learning524
    • Business & Productivity294
    • Web Development216
    • Security & Monitoring188
    • Communication & Collaboration165
    • Browse all 21 categories
  • Blog
  • Advertise
Submit your project

New open source projects by email

The projects we add and every new guide. Free, unsubscribe any time.

Open Source Alternatives LogoOpen Source Alternatives

Handpicked Open Source Alternatives to Paid Softwares

Add Open Source Alternatives as a preferred source on Google

Product

  • Categories
  • Tag
  • Advertise

Resources

  • Blog
  • Collection
  • Submit

Company

  • Privacy Policy
  • Terms of Service
  • Refund Policy
  • Sitemap

Alternatives

  • Claude Code
  • Jira
  • Notion
  • Slack
  • Linear
  • Wispr Flow
  • All alternatives
© 2026 Open Source Alternatives. All rights reserved.
Open SourceAlternatives
Home/Categories/Security & Monitoring/Icinga2
icon of Icinga2

Icinga2

Open source alternative to Datadog, Paessler PRTG and Nagios XI

  • 2.2K stars
  • GPL-3.0
  • Active this week
  • Last commit today

Last verified Nov 12, 2026

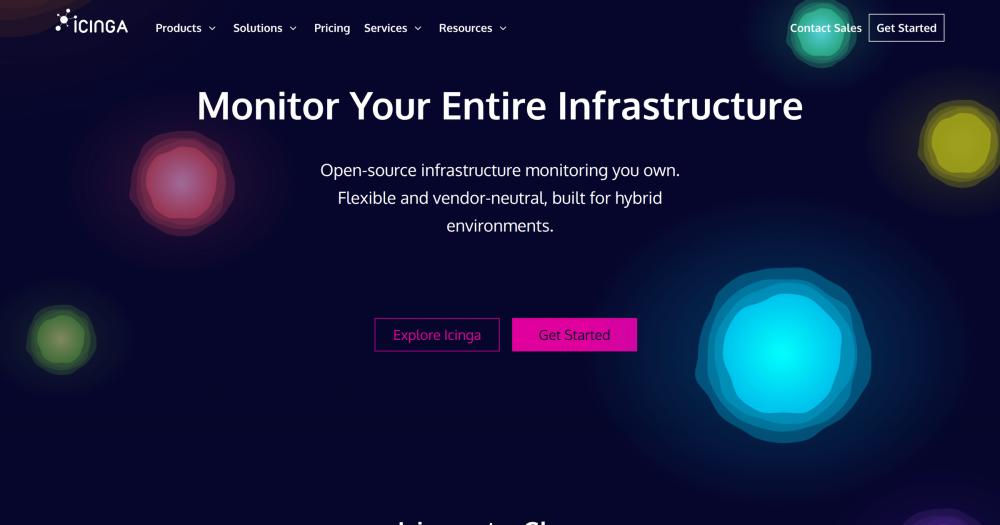
Monitor infrastructure availability, generate performance data, and notify teams of outages with a self-hosted GPL-licensed monitoring server.

Visit websiteGitHub2.2K starsDeploy on Hostinger
image of Icinga2
TL;DR

Icinga2 Icinga 2 is a GPL-3.0 licensed open source monitoring server that checks network and infrastructure availability, sends notifications on outages, and feeds performance data into Graphite, InfluxDB, OpenTSDB, and Elasticsearch. It replaces paid monitoring platforms such as Datadog and Paessler PRTG for teams that need self-hosted control over their monitoring stack with no per-host licensing costs. Configuration is written in the Icinga DSL or managed through the Icinga Director web UI. Best for sysadmins and DevOps teams running distributed infrastructure across data centers or hybrid cloud environments.

Read the full breakdownHide the full breakdownWho it is for, how it works, trade-offs and the FAQ
who it's for

Who Icinga2 is for#

Sysadmins running multi-site or hybrid cloud infrastructure

Icinga 2 handles distributed monitoring across locations without requiring a central monitoring point. Its cluster mode synchronizes check state and notifications across zones, making it suited for environments that span multiple data centers or cloud regions.

Skip if:

If your infrastructure is confined to a single location and fewer than a few dozen hosts, a lighter tool with less configuration overhead may serve you better.

DevOps teams integrating monitoring into CI/CD pipelines

The REST API lets teams register hosts and services dynamically, query check state from deployment scripts, and trigger external checks programmatically. This fits automation-heavy workflows where monitoring configuration changes alongside application deployments.

Skip if:

If your team has no need to automate monitoring configuration or query check results programmatically, the REST API adds complexity that a simpler setup would avoid.

Teams migrating away from Nagios XI or similar legacy setups

Icinga 2 was designed with Nagios compatibility in mind and supports existing Nagios check plugins. The Icinga Director add-on provides a configuration UI that reduces the manual editing that Nagios users are accustomed to. Teams already running Nagios-based setups will find the migration path shorter than moving to an entirely different monitoring model.

Skip if:

If you are replacing a simple Nagios installation and do not need distributed monitoring or REST API integration, Icinga 2's setup complexity may exceed what you need.

the problem

The problem it solves#

Infrastructure monitoring at scale combines several frustrating challenges. Paid SaaS tools such as Datadog charge per host, so costs grow with the environment; a team monitoring hundreds of servers faces a substantial monthly bill with no flexibility to renegotiate or self-host. Tools tied to proprietary agents lock all monitoring data inside the vendor's platform, with no path to ownership or migration.

The configuration requirements of large-scale monitoring are significant on their own. Mapping different check types for hosts, services, networks, and applications, with routing rules for who gets notified at what threshold and over which channel, takes substantial planning effort. Many teams manage this complexity with a patchwork of tools, losing visibility at the seams.

how Icinga2 solves it

How it solves it#

Distributed cluster monitoring

Runs monitoring across multiple nodes and locations without a single point of failure. The cluster mode synchronizes check schedules, host status, and notifications across zones, so a monitoring setup spanning multiple data centers or hybrid cloud regions stays consistent.

Icinga DSL configuration language

Configuration is written in the Icinga DSL, a typed language that covers hosts, services, check commands, notification rules, and timeframes in one consistent model. For teams that prefer a GUI, the Icinga Director add-on generates configuration objects from a web form without requiring direct DSL editing.

Performance data backends

Ships check performance data to Graphite, InfluxDB, OpenTSDB, and Elasticsearch, so metrics feed directly into existing dashboards and alerting pipelines. The integration is built into the monitoring server, not an external sidecar.

REST API for automation

Exposes a REST API for external check submissions, object queries, action triggers, and configuration reads. Useful for CI/CD pipelines that want to register checks dynamically or for tooling that needs to query host and service status programmatically.

TLS-secured cluster communications

All communication between Icinga 2 nodes, including check results and cluster sync, runs over TLS. Certificates are managed through Icinga's own PKI tooling, reducing the external dependency for certificate setup in distributed deployments.

strengths · trade-offs

Strengths and trade-offs#

Strengths

  • No per-host licensing costsRunning Icinga 2 on your own infrastructure costs nothing beyond the hardware. Unlike Datadog, which bills per host per month, or Paessler PRTG, which licenses by sensor count, Icinga 2 is GPL-3.0 licensed and free to run at any scale. Organizations monitoring hundreds of hosts see the cost difference most clearly.
  • Data stays on your infrastructureCheck results, performance data, and notification history never leave your systems. For teams operating under data residency requirements or running in air-gapped environments, this is a hard requirement that hosted SaaS monitoring tools cannot meet.
  • Integrates with existing metrics toolingIcinga 2 ships performance data to the time-series tool you already run: Graphite, InfluxDB, OpenTSDB, or Elasticsearch. No separate exporter or middleware is needed. The same data feeds both Icinga dashboards and your general-purpose observability stack.
  • Active development and professional supportThe repository has been in continuous development since 2013, with the most recent push in November 2026. The project has 2,247 GitHub stars and 623 forks. Commercial support contracts are available through Icinga's partner network for organizations that need guaranteed response times.

Trade-offs

  • -Requires Icinga Web 2 for the browser interfaceIcinga 2 is the monitoring engine only. To get a browser-based view of host and service state, you must install Icinga Web 2 separately, which requires its own dependencies and configuration. The stack is capable but multi-component. Plan the installation carefully if you are not running a configuration management tool.
  • -362 open GitHub issuesThe project has 362 open issues covering edge cases in cluster configuration, specific integration behaviors, and platform-specific bugs. The project remains under active development, so not all issues reflect current behavior, but users running less common configurations should review the issue tracker before deploying.
  • -Configuration language learning curveThe Icinga DSL is expressive but has its own syntax and type model. Teams migrating from simpler tools or Nagios-compatible configurations will need time to learn it. The Icinga Director web UI reduces this for straightforward setups, but complex custom check commands still require learning the DSL.
versus alternatives

Icinga2 vs alternatives#

Icinga 2 vs Datadog

Datadog is a fully managed observability platform covering infrastructure metrics, APM, log management, and security. Icinga 2 is a self-hosted monitoring server focused on host and service availability checks with performance data output.

FeatureIcinga 2Datadog
LicenseGPL-3.0Proprietary SaaS
Self-hostingYesNo
PricingFree to self-hostPer-host monthly billing
Config methodIcinga DSL, Director UIWeb UI, agent config

Icinga 2 is the better choice when cost at scale is the driver. Datadog's per-host billing grows quickly at hundreds of nodes, and teams with data residency requirements or air-gapped environments need a self-hosted option that Datadog cannot provide. Datadog is worth the cost when you need fully managed APM, log management, and security tooling with no infrastructure to operate.

Icinga 2 vs Paessler PRTG

PRTG is an all-in-one network monitoring tool with 250+ built-in sensor types and auto-discovery. Icinga 2 uses configurable check commands and a distributed cluster model across Linux and Windows.

FeatureIcinga 2Paessler PRTG
LicenseGPL-3.0Proprietary, sensor-based pricing
Self-hostingYesYes (Windows server)
Auto-discoveryVia pluginsBuilt-in
ConfigIcinga DSL / DirectorWeb UI

Icinga 2 is the better choice when you need Linux hosting, integration with Graphite or InfluxDB, or want to avoid sensor-count licensing costs. PRTG fits when you want fast setup with built-in auto-discovery in a Windows-centric environment.

Icinga 2 vs Nagios XI

Nagios XI is a commercial product built on the open-source Nagios engine. Icinga 2 was designed as a Nagios redesign, adding cluster architecture, a typed configuration language, and a REST API.

FeatureIcinga 2Nagios XI
LicenseGPL-3.0Proprietary
Plugin compatibilityNagios plugins supportedNagios plugins
Distributed monitoringYes (native cluster)Add-on required
REST APIYesLimited

Icinga 2 is the better choice when you need distributed monitoring, a REST API for automation, and no commercial licensing cost. Existing Nagios check plugins run on Icinga 2 without changes. Nagios XI fits when your team has deep existing expertise in the Nagios XI interface and needs commercial support directly from Nagios Enterprises.

tech stack · detected from GitHub

What it's built on#

Languages
C#C++
frequently asked

FAQ#

Does Icinga 2 work with existing Nagios plugins?

Yes. Icinga 2 supports existing Nagios check plugins without modification. The monitoring configuration syntax differs from Nagios configuration files, but the actual check scripts, written in Perl, Bash, or any language the system can run, work unchanged. Teams migrating from Nagios can reuse their existing check scripts while adopting the Icinga DSL for configuration.

Does Icinga 2 include a web interface?

No. Icinga 2 is the monitoring engine only. The browser-based view of host and service state comes from Icinga Web 2, which is a separate component in the Icinga Stack. Both must be installed and configured together for a complete monitoring setup. The Icinga Web 2 documentation is available at icinga.com/docs.

What license does Icinga 2 use?

Icinga 2 is licensed under the GNU General Public License Version 3 (GPL-3.0). This means you can run it on your own infrastructure, modify it, and distribute modified versions, provided changes are released under the same GPL-3.0 terms. There is no commercial license restriction on running it internally for your own organization.

What metrics backends does Icinga 2 support?

Icinga 2 ships check performance data to Graphite, InfluxDB, OpenTSDB, and Elasticsearch. These are configured as features in the monitoring server. The metrics reach your existing dashboards and alerting pipelines without an external exporter or middleware.

Is Icinga 2 still actively maintained?

Yes. The GitHub repository shows continuous development since 2013, with the most recent push in November 2026. The project has 2,247 stars and 623 forks on GitHub. Commercial support contracts are available through Icinga's partner network for organizations that need guaranteed response times or professional assistance.

also worth a look

Similar open-source tools#

Apache SkyWalking

Alternative toDatadog

APM platform covering traces, metrics, logs, and AI agent monitoring.

  • 25,004 GitHub stars
  • Apache-2.0Licence Apache-2.0

Checkmk

Alternative toDatadog

Hybrid IT monitoring with auto-discovery and 2,000+ integrations.

  • 2,643 GitHub stars
  • GPL-2.0Licence GPL-2.0

Uptrace

Alternative toDatadog

Self-hosted APM for distributed traces, metrics, and logs.

  • 4,311 GitHub stars
  • AGPL-3.0Licence AGPL-3.0

ClickStack

Alternative toDatadog

Self-hosted observability stack on ClickHouse with session replay

  • 10,031 GitHub stars
  • MITLicence MIT

Beszel

Alternative toDatadog

Self-hosted server monitoring with Docker stats and disk health.

  • 27,156 GitHub stars
  • MITLicence MIT

Prometheus

Alternative toDatadog

Time series monitoring with a dimensional model and PromQL query language.

  • 67,616 GitHub stars
  • Apache-2.0Licence Apache-2.0
by category

Open source tools in these categories#

188

Security & Monitoring

REA (Reverse Engineer Anything), RustDesk, Sherlock
154

IT Management

RustDesk, Immich, Stirling PDF
129

DevOps & CI/CD

Nvm, Uptime Kuma, Netdata
Hostinger

Self-host Icinga2 on a Hostinger VPS

Keep it running 24/7, even when your laptop is off. A Hostinger VPS gives it a server of its own.

  1. 01

    Choose a plan

    Starts from $6.49/mo

  2. 02

    Apply

    Extra 10% off yearly plans

  3. 03

    Install Icinga2

    On a server that stays on

  4. 04

    Start building

    Focus on the app, not the server

Deploy on Hostinger

Sponsors

Inbox Zero

Alternative toSuperhuman

AI email assistant that drafts replies and clears your inbox

  • 12,987 GitHub stars
  • AGPL-3.0Licence AGPL-3.0
  • #Email

rakazo

Alternative toGrok Bot

AI teammates you own: your keys, your model, your machine.

  • 7,869 GitHub stars
  • Apache-2.0Licence Apache-2.0
  • #AI Agents

SnitchFeed

Live monitoring on LinkedIn, X, Reddit & more. Agentic social listening for startups.

Marketing & Growth

Advertise your product

New open source projects by email

The projects we add and every new guide. Free, unsubscribe any time.

Find open source alternatives to paid software

/
  • Claude Code to OpenCode
  • Jira to Windshift
  • Notion to AppFlowy
  • Slack to Mattermost
  • Linear to GitLab
  • Wispr Flow to Handy
  • Arc to Zen Browser
  • CapCut to Concat
  • Grok Bot to rakazo
  • Superhuman to Inbox Zero
  • Airtable to AITable
  • Muse to OpenClaw
  • Railway to Coolify
  • GitHub Copilot to Cline
  • Datadog to Netdata
  • Confluence to Wiki.js
  • Discord to Fluxer
  • Microsoft Teams to Rocket.Chat
  • 1Password to KeePassXC
  • Firebase to Supabase
  • Pinecone to Qdrant
  • Zapier to n8n
  • Devin AI to OpenHands
  • Asana to Leantime
  • Claude Code to OpenCode
  • Jira to Windshift
  • Notion to AppFlowy
  • Slack to Mattermost
  • Linear to GitLab
  • Wispr Flow to Handy
  • Arc to Zen Browser
  • CapCut to Concat
  • Grok Bot to rakazo
  • Superhuman to Inbox Zero
  • Airtable to AITable
  • Muse to OpenClaw
  • Railway to Coolify
  • GitHub Copilot to Cline
  • Datadog to Netdata
  • Confluence to Wiki.js
  • Discord to Fluxer
  • Microsoft Teams to Rocket.Chat
  • 1Password to KeePassXC
  • Firebase to Supabase
  • Pinecone to Qdrant
  • Zapier to n8n
  • Devin AI to OpenHands
  • Asana to Leantime