Open Source Alternatives
  • Alternatives
  • Categories
    Categories by size1,219 projects
    • Developer Tools626
    • AI & Machine Learning525
    • Business & Productivity294
    • Web Development216
    • Security & Monitoring190
    • Communication & Collaboration165
    • IT Management156
    • LLMOps & AI Tooling133
    • DevOps & CI/CD131
    • Cloud & Hosting130
    Browse all 21 categoriesDesign & Creative, Product & Project Management and 9 more
  • Blog
  • Advertise
SearchNotion, Slack, password manager.../
Submit
Open Source Alternatives
  • Alternatives
    • Developer Tools626
    • AI & Machine Learning525
    • Business & Productivity294
    • Web Development216
    • Security & Monitoring190
    • Communication & Collaboration165
    • Browse all 21 categories
  • Blog
  • Advertise
Submit your project

New open source projects by email

The projects we add and every new guide. Free, unsubscribe any time.

Open Source Alternatives LogoOpen Source Alternatives

Handpicked Open Source Alternatives to Paid Softwares

Add Open Source Alternatives as a preferred source on Google

Product

  • Categories
  • Tag
  • Advertise

Resources

  • Blog
  • Collection
  • Submit

Company

  • Privacy Policy
  • Terms of Service
  • Refund Policy
  • Sitemap

Alternatives

  • Claude Code
  • Jira
  • Notion
  • Slack
  • Linear
  • Wispr Flow
  • All alternatives
© 2026 Open Source Alternatives. All rights reserved.
Open SourceAlternatives
Home/Categories/Security & Monitoring/OneUptime
icon of OneUptime

OneUptime

Open source alternative to Datadog, PagerDuty, Better Stack and Incident.io

  • 7.8K stars
  • Apache-2.0
  • Active this week
  • Last commit 1 day ago

Last verified Nov 10, 2026

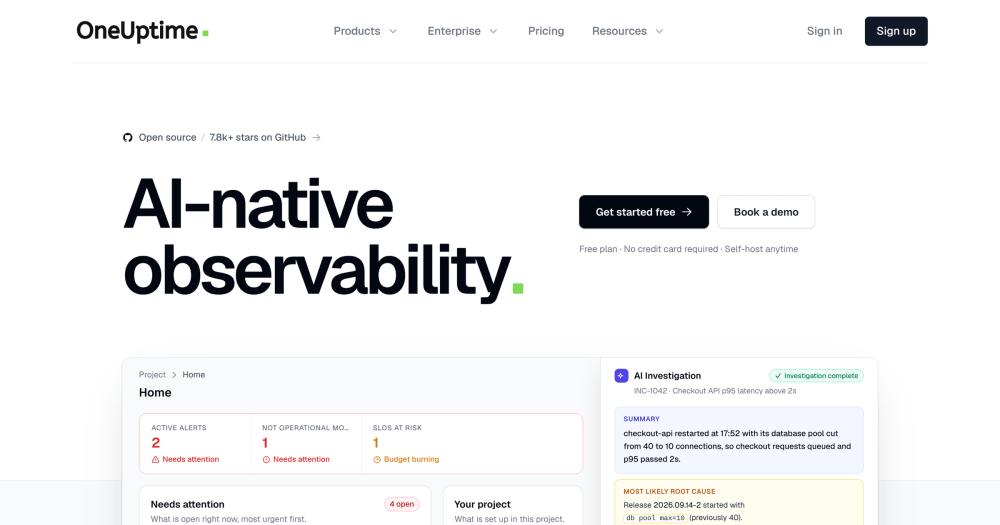
Monitor websites, APIs, servers, and Kubernetes; manage on-call schedules, incidents, and status pages in one self-hosted observability platform.

Visit websiteGitHub7.8K starsDeploy on Hostinger
image of OneUptime
TL;DR

OneUptime is an open source observability and incident management tool that puts uptime monitoring, on-call scheduling, incident response, status pages, and OpenTelemetry-native logs, metrics, and traces in one place. It replaces separate paid tools like Datadog for observability and PagerDuty for on-call, with an AI agent that investigates incidents and can open pull requests with proposed fixes. The community edition is free to run under Apache 2.0, with Docker Compose for single servers and Kubernetes with Helm for production scale. Best for engineering teams managing production systems who want consolidated observability and incident management without sending monitoring data to a third party.

Read the full breakdownHide the full breakdownWho it is for, how it works, trade-offs, the quick start and the FAQ
who it's for

Who OneUptime is for#

Engineering teams consolidating monitoring tools

Teams running separate uptime monitoring, on-call, logging, and status page products can replace all of them with one self-hosted OneUptime install. The alert and the trace that explains it appear in the same interface, so the on-call engineer does not need to log into multiple dashboards during an incident.

Skip if:

Teams already using Datadog with deep custom dashboards, proprietary APM integrations, or complex ML-based anomaly detection will find OneUptime's current observability breadth narrower than what Datadog provides at the high end of its feature set.

Organizations with strict data residency requirements

Financial services, healthcare, and government teams that cannot send monitoring data to third-party clouds can self-host OneUptime on their own infrastructure or run it air-gapped. Logs, metrics, traces, and incident data stay entirely within the organization's network, with no outbound telemetry to the vendor.

Skip if:

Organizations where the operational overhead of running a monitoring stack on internal infrastructure outweighs the data residency need. For teams without a dedicated platform team, the managed cloud edition at oneuptime.com may be the better starting point.

DevOps teams adopting OpenTelemetry

Services instrumented with OpenTelemetry SDK send logs, metrics, and traces to OneUptime without a proprietary agent or SDK change. Kubernetes clusters, Docker containers, and Proxmox VMs feed infrastructure data into the same telemetry store that holds application traces, so infrastructure and application observability share one view.

Skip if:

Teams running proprietary APM agents already (Datadog APM, New Relic APM) where migrating instrumentation would be a large project. OTel migration is a one-time cost but a real one that deserves a planned effort.

the problem

The problem it solves#

Engineering teams managing production systems often run three or more separate paid services to cover monitoring: one for uptime checks, another for on-call and incident management, a third for logs and traces, and a fourth for status pages. Each tool has its own account, billing, and integration, so the alert fires in one place, the trace lives in another, and the fix goes into a ticket in a third. Beyond the coordination cost, the bills accumulate: observability tools charge per host per month, on-call tools charge per user per seat, and each additional product means another contract and another vendor with access to production metrics.

The result is monitoring data scattered across vendors with no shared timeline. When an incident opens, an on-call engineer switches between tools to find the trace that explains the alert. For teams in regulated industries or with strict data-residency requirements, sending every server metric and every log line to multiple third-party clouds creates compliance exposure with no straightforward answer.

how OneUptime solves it

How it solves it#

Uptime monitoring from probes worldwide

Checks websites, APIs, server ports, DNS records, and TLS certificates from probes around the world every 10 seconds. Monitors cover HTTP/HTTPS, TCP, ICMP ping, DNS, SSL certificate expiry, and synthetic checks of real user flows. Inside-network probes can monitor services that are not reachable from the public internet, such as internal APIs and databases. The same probe infrastructure runs on the cloud edition and on self-hosted installs.

On-call scheduling and multi-channel alerting

Pages whoever is on-call by phone call, SMS, email, push notification, Slack, or Microsoft Teams when a check fails. Escalation policies define what happens when the primary contact does not respond within a set time: the incident escalates to the next person in the rotation. Schedules, rotations, and escalation chains are configurable from the UI. On-call policies can be triggered directly from Slack using the /oneuptime page command.

Incident timeline from alert to postmortem

Each incident gets one timeline: the check that opened it, every acknowledgment and status change, the on-call escalation, subscriber page updates, and the resolution all appear in order. Incident roles (incident commander, communications lead) are assignable within the incident. The timeline feeds the postmortem without manual reconstruction and shows how long the incident was open and who responded.

OpenTelemetry-native logs, metrics, and traces

Accepts logs, metrics, and traces via OpenTelemetry, so any service already instrumented for OTel sends data without a proprietary SDK or agent change. Logs are searchable and can be tailed in real time. Traces show spans across services in a waterfall and flame graph view with time spent per service. Error tracking groups exceptions by fingerprint with owner assignment. Real user monitoring and CPU and memory profiling are also included.

AI incident investigation and fix pull requests

When an incident opens, the AI agent reads the incident's traces, logs, metrics, and recent deploys automatically and writes a root cause analysis in plain English with cited evidence. It can open a pull request on GitHub or GitLab proposing a fix for the team to review. The agent runs read-only; it makes no changes to any system without human review and merging. Teams supply their own LLM and API keys or use OneUptime's hosted model.

Status pages with subscriber notifications

Public or private status pages on a custom domain update from monitor state automatically, so the customer-facing page reflects what the on-call team is seeing without manual posts. Subscribers receive notifications by email or SMS when a resource goes down or when a maintenance window is scheduled. Teams can maintain multiple status pages for different audiences from one OneUptime instance.

strengths · trade-offs

Strengths and trade-offs#

Strengths

  • Replaces five separate paid tools in one self-hosted installThe website names the tools it replaces directly: Pingdom (uptime), Statuspage (status pages), PagerDuty (on-call), Datadog (observability), and Sentry (error tracking). One testimonial from the CTO of Cloudwave Technologies notes that the team consolidated Datadog, PagerDuty, and Statuspage into OneUptime and that the cost savings alone justified the switch. Running the same coverage on self-hosted hardware eliminates five per-seat and per-event billing lines at once.
  • Air-gapped deployment for regulated environmentsThe same Docker images and Helm chart that power the cloud edition run with no internet connection. Signed images, a local registry, an on-premises mail server, and an identity provider (SAML or OIDC) handle every dependency that would otherwise require internet access. AI is optional and runs on a locally deployed model when configured. This path is documented specifically for government, defense, critical infrastructure, and regulated industries where monitoring data leaving the network is.
  • Apache 2.0 community edition with no license fees at any scaleThe community edition runs under Apache 2.0 and carries no per-host, per-user, or per-event fee at any scale. The community image contains no code from the ee/ directory, which holds enterprise-only features. Kubernetes installs via Helm and Docker Compose installs on a single server both run the same codebase. Teams keep monitoring data, incident history, and telemetry on infrastructure they own and can audit.
  • Built-in MCP server for AI coding tool accessThe built-in MCP server at oneuptime.com/mcp lets Claude, Cursor, VS Code with GitHub Copilot, and any other MCP client query incidents, logs, and traces, acknowledge an alert, or set up a monitor by describing what they want. Teams using AI coding tools can point them at production observability data without building a custom integration. This is documented as a first-class feature, not a third-party add-on.

Trade-offs

  • -High resource requirement for self-hosted installsThe Docker Compose install requires a Linux server with at least 8 GB of memory. The stack runs multiple containers: PostgreSQL stores configuration and state, ClickHouse handles logs, metrics, and traces, and Valkey handles cache and queues. A 1-2 GB VPS cannot run OneUptime reliably. Teams need a dedicated server or a suitably sized cloud instance. Kubernetes with Helm is the recommended path for production scale.
  • -752 open issues on GitHubThe repository had 752 open issues at the time of writing (GitHub search API count, pull requests excluded). The project is in active development, which means bugs and feature requests accumulate. Users should check open issues for known problems in their specific infrastructure environment before deploying to production.
  • -Enterprise features require a separate licenseSCIM provisioning, audit logs, team compliance dashboards, and instance health dashboards are in the ee/ directory, which is licensed under the OneUptime Enterprise License. Production use of these features requires an enterprise license from OneUptime. The community edition covers monitoring, on-call, incidents, status pages, logs, metrics, traces, and SSO (SAML and OIDC) without a fee; audit trails and directory sync require the enterprise tier.
versus alternatives

OneUptime vs alternatives#

OneUptime vs Datadog

Both cover infrastructure monitoring, logs, metrics, and traces. The main split is deployment model and cost: Datadog is managed-only with per-host pricing; OneUptime is self-hosted by default and free under the Apache 2.0 community edition.

FeatureOneUptimeDatadog
LicenseApache 2.0 (Community)Proprietary
Self-hostingYesNo
Telemetry ingestOpenTelemetry nativeProprietary agent and OTel
On-call schedulingBuilt inRequires a separate tool
Status pagesBuilt inNot included

Datadog is the better fit when teams need ML-based anomaly detection, long-retention distributed tracing at scale, or deep integrations from its marketplace of specialized checks. OneUptime covers the core observability and incident stack at zero license cost for teams that can run their own infrastructure and do not require Datadog's ML anomaly tier.

OneUptime vs PagerDuty

PagerDuty is a commercial incident response and on-call tool. OneUptime covers the same on-call and incident workflow as part of an integrated observability stack, while PagerDuty connects to external monitoring tools and handles the paging and escalation layer only.

FeatureOneUptimePagerDuty
LicenseApache 2.0 (Community)Proprietary
Self-hostingYesNo
Built-in uptime monitoringYesNo
Built-in observabilityYesNo
On-call schedulingYesYes
PricingFree (self-hosted)Per user per month

PagerDuty is worth considering for teams already running Datadog or Prometheus who want best-in-class alert routing without changing their existing monitoring stack. OneUptime is the better fit when the team is building the observability stack from scratch and wants the alert and the trace that caused it in the same interface.

OneUptime vs Better Stack

Better Stack combines uptime monitoring, logging, and incident management in a managed SaaS product. OneUptime covers the same functional scope and also includes on-call scheduling and OpenTelemetry tracing.

FeatureOneUptimeBetter Stack
LicenseApache 2.0 (Community)Proprietary
Self-hostingYesNo
OpenTelemetry tracingYesLogs and metrics only
On-call schedulingYesYes
AI incident investigationYesNo

Better Stack suits teams that want a managed product with strong logging and status page UX and no infrastructure to run. OneUptime is the better choice for teams that want the full observability and incident stack self-hosted, need tracing alongside logs and metrics, or cannot send monitoring data to external services.

install · quick start

Quick start#

bash
Deploy OneUptime on a Linux server with Docker using the official install script.

```bash
curl -fsSL https://oneuptime.com/install.sh | bash
```

For Kubernetes, install with Helm:

```bash
helm repo add oneuptime https://helm-chart.oneuptime.com/
helm install my-oneuptime oneuptime/oneuptime --set host=oneuptime.example.com
```
tech stack · detected from GitHub

What it's built on#

Languages
JavaScriptTypeScript
frequently asked

FAQ#

Is OneUptime free to use?

Yes: the Community Edition runs under Apache 2.0 and is free at any scale on your own hardware, with no per-host, per-user, or per-event fee. OneUptime Cloud also has a free plan with no credit card required, covering website and API monitoring, a status page with 100 subscribers, and basic incident management. Cloud paid plans start at $22 per user per month plus $1 per active monitor per month and $0.10 per GB of ingested telemetry. Enterprise features (SCIM, audit logs) in the ee/ directory require a separate Enterprise Edition license.

What infrastructure does a self-hosted OneUptime install require?

The Docker Compose install requires a Linux server with at least 8 GB of memory, running Ubuntu, Debian, or a RHEL-based distribution. The stack includes PostgreSQL for configuration and state, ClickHouse for logs and telemetry, and Valkey for cache and queues. For high availability at scale, the Helm chart installs on Kubernetes. An air-gapped install is supported: signed images, a local registry, and an on-premises mail server and identity provider replace every internet dependency.

Does OneUptime support OpenTelemetry?

Yes. OneUptime accepts logs, metrics, and traces via the OpenTelemetry protocol, so any service already instrumented with an OTel SDK sends telemetry without a proprietary agent or code change. Infrastructure monitoring covers Kubernetes (via eBPF and service maps), Docker, VMware, cloud providers (AWS, GCP, Azure), and network devices. The same telemetry store holds both application traces and infrastructure metrics.

How does OneUptime AI work, and what can it access?

When an incident opens, the AI agent reads the incident's traces, logs, metrics, and recent deploys automatically and produces a root cause analysis in plain English, citing each piece of evidence. It can open a pull request on GitHub or GitLab proposing a fix. The agent runs read-only: it makes no changes to any system without a human reviewing and merging the PR. Teams supply their own LLM and API keys, or use OneUptime's hosted model. A built-in MCP server also lets AI coding tools (Claude, Cursor, VS Code Copilot) query incidents and logs directly.

also worth a look

Similar open-source tools#

Beszel

Alternative toDatadog

Self-hosted server monitoring with Docker stats and disk health.

  • 27,156 GitHub stars
  • MITLicence MIT

OpenSRE

Alternative toIncident.io

Accelerate incident resolution with intelligent alert investigation

  • 12,806 GitHub stars
  • Apache-2.0Licence Apache-2.0

Zabbix

Alternative toDatadog

Self-hosted enterprise monitoring with agent and agentless collection.

  • 6,557 GitHub stars
  • AGPL-3.0Licence AGPL-3.0

Apache SkyWalking

Alternative toDatadog

APM platform covering traces, metrics, logs, and AI agent monitoring.

  • 25,004 GitHub stars
  • Apache-2.0Licence Apache-2.0

Icinga2

Alternative toDatadog

Self-hosted monitoring server for infrastructure and network checks.

  • 2,247 GitHub stars
  • GPL-3.0Licence GPL-3.0

Checkmk

Alternative toDatadog

Hybrid IT monitoring with auto-discovery and 2,000+ integrations.

  • 2,643 GitHub stars
  • GPL-2.0Licence GPL-2.0
by category

Open source tools in these categories#

190

Security & Monitoring

REA (Reverse Engineer Anything), RustDesk, Sherlock
131

DevOps & CI/CD

Nvm, Uptime Kuma, Netdata
156

IT Management

RustDesk, Immich, Stirling PDF
Hostinger

Self-host OneUptime on a Hostinger VPS

Keep it running 24/7, even when your laptop is off. A Hostinger VPS gives it a server of its own.

  1. 01

    Choose a plan

    Starts from $6.49/mo

  2. 02

    Apply

    Extra 10% off yearly plans

  3. 03

    Install OneUptime

    On a server that stays on

  4. 04

    Start building

    Focus on the app, not the server

Deploy on Hostinger

Sponsors

Inbox Zero

Alternative toSuperhuman

AI email assistant that drafts replies and clears your inbox

  • 12,987 GitHub stars
  • AGPL-3.0Licence AGPL-3.0
  • #Email

rakazo

Alternative toGrok Bot

AI teammates you own: your keys, your model, your machine.

  • 7,869 GitHub stars
  • Apache-2.0Licence Apache-2.0
  • #AI Agents

SnitchFeed

Live monitoring on LinkedIn, X, Reddit & more. Agentic social listening for startups.

Marketing & Growth

Advertise your product

New open source projects by email

The projects we add and every new guide. Free, unsubscribe any time.

Find open source alternatives to paid software

/
  • Claude Code to OpenCode
  • Jira to Windshift
  • Notion to AppFlowy
  • Slack to Mattermost
  • Linear to GitLab
  • Wispr Flow to Handy
  • Arc to Zen Browser
  • CapCut to Concat
  • Grok Bot to rakazo
  • Superhuman to Inbox Zero
  • Airtable to AITable
  • Muse to OpenClaw
  • Railway to Coolify
  • GitHub Copilot to Cline
  • Datadog to Netdata
  • Confluence to Wiki.js
  • Discord to Fluxer
  • Microsoft Teams to Rocket.Chat
  • 1Password to KeePassXC
  • Firebase to Supabase
  • Pinecone to Qdrant
  • Zapier to n8n
  • Devin AI to OpenHands
  • Asana to Leantime
  • Claude Code to OpenCode
  • Jira to Windshift
  • Notion to AppFlowy
  • Slack to Mattermost
  • Linear to GitLab
  • Wispr Flow to Handy
  • Arc to Zen Browser
  • CapCut to Concat
  • Grok Bot to rakazo
  • Superhuman to Inbox Zero
  • Airtable to AITable
  • Muse to OpenClaw
  • Railway to Coolify
  • GitHub Copilot to Cline
  • Datadog to Netdata
  • Confluence to Wiki.js
  • Discord to Fluxer
  • Microsoft Teams to Rocket.Chat
  • 1Password to KeePassXC
  • Firebase to Supabase
  • Pinecone to Qdrant
  • Zapier to n8n
  • Devin AI to OpenHands
  • Asana to Leantime