Open Source Alternatives
  • Alternatives
  • Categories
    Categories by size1,219 projects
    • Developer Tools626
    • AI & Machine Learning525
    • Business & Productivity294
    • Web Development216
    • Security & Monitoring190
    • Communication & Collaboration165
    • IT Management156
    • LLMOps & AI Tooling133
    • DevOps & CI/CD131
    • Cloud & Hosting130
    Browse all 21 categoriesDesign & Creative, Product & Project Management and 9 more
  • Blog
  • Advertise
SearchNotion, Slack, password manager.../
Submit
Open Source Alternatives
  • Alternatives
    • Developer Tools626
    • AI & Machine Learning525
    • Business & Productivity294
    • Web Development216
    • Security & Monitoring190
    • Communication & Collaboration165
    • Browse all 21 categories
  • Blog
  • Advertise
Submit your project

New open source projects by email

The projects we add and every new guide. Free, unsubscribe any time.

Open Source Alternatives LogoOpen Source Alternatives

Handpicked Open Source Alternatives to Paid Softwares

Add Open Source Alternatives as a preferred source on Google

Product

  • Categories
  • Tag
  • Advertise

Resources

  • Blog
  • Collection
  • Submit

Company

  • Privacy Policy
  • Terms of Service
  • Refund Policy
  • Sitemap

Alternatives

  • Claude Code
  • Jira
  • Notion
  • Slack
  • Linear
  • Wispr Flow
  • All alternatives
© 2026 Open Source Alternatives. All rights reserved.
Open SourceAlternatives
Home/Categories/Security & Monitoring/Zabbix
icon of Zabbix

Zabbix

Open source alternative to Datadog, PRTG Network Monitor, SolarWinds Network Performance Monitor and Nagios XI

  • 6.6K stars
  • AGPL-3.0
  • Active this week
  • Last commit 1 day ago

Last verified Nov 11, 2026

Monitor IT infrastructure, networks, servers, and cloud resources with an AGPL-licensed self-hosted platform used by Fortune 500 enterprises.

Visit websiteGitHub6.6K starsDeploy on Hostinger
image of Zabbix
TL;DR

Zabbix is an open source enterprise monitoring platform that tracks servers, networks, virtual machines, containers, and cloud services from a single instance. It replaces paid monitoring tools like Datadog, PRTG, and SolarWinds NPM with a self-hosted setup that carries no per-device license fees. Licensed under AGPL-3.0, it deploys on your own hardware or VM with a database and web frontend. Best for infrastructure teams managing complex, multi-site environments where cost scales with device count on commercial platforms.

Read the full breakdownHide the full breakdownWho it is for, how it works, trade-offs and the FAQ
who it's for

Who Zabbix is for#

Infrastructure teams monitoring large mixed environments

Teams operating hundreds of servers, network devices, VMs, and cloud resources across multiple data centers need a single tool that covers every layer. Zabbix handles network devices, VMs, cloud services, and containers from one instance, with discovery and templating reducing manual onboarding work.

Skip if:

Your infrastructure is small (under 50 devices) and mostly cloud-native. A lighter tool or a managed SaaS with a low-tier plan may be simpler to operate for small-scale environments.

MSPs managing monitoring for multiple clients

Zabbix's multitenancy support lets managed service providers segment monitoring by client under one installation, with separate views, alert channels, and report recipients per customer. The website names 290+ partners across North and South America, Europe, Asia, and Australia, confirming this as a primary deployment pattern.

Skip if:

You are monitoring only your own infrastructure with a small team. The multitenancy features add configuration complexity that single-tenant deployments do not need.

Enterprises in regulated industries requiring on-premises data

Financial institutions, healthcare providers, and government agencies that cannot send infrastructure telemetry to external services benefit from Zabbix's fully self-hosted architecture. SEB Bank and the European Space Agency are cited as users on the Zabbix website.

Skip if:

Your compliance posture allows SaaS telemetry storage. If data residency is not a requirement, a managed monitoring platform reduces operational overhead.

Teams migrating from Nagios

Nagios XI is a commercial platform built on the open source Nagios engine. Zabbix covers the same infrastructure monitoring domain with a modern web interface, automated discovery, and built-in alerting integrations that Nagios achieves through separately maintained plugins.

Skip if:

Your Nagios setup is small and already well-configured. If the existing deployment works for your needs, a migration to Zabbix carries non-trivial setup time.

the problem

The problem it solves#

IT infrastructure monitoring at scale becomes expensive fast. Platforms like Datadog and PRTG charge per host, per container, or per sensor, so a team monitoring a few hundred servers pays tens of thousands of dollars annually just to know whether its systems are running. The cost only grows as infrastructure grows.

The harder problem is data correlation. A network outage, a database slowdown, and an application error can be three symptoms of one root cause, but tooling that monitors each layer separately forces engineers to correlate manually. Without automated root cause analysis, an on-call engineer chases alerts across three dashboards instead of seeing one clear problem.

how Zabbix solves it

How it solves it#

Agent and agentless metric collection

Collects metrics from servers, VMs, container platforms like Docker and Kubernetes, cloud services, databases, web pages, Java ecosystems, application servers, and API endpoints using either a lightweight agent or agentless methods. Out-of-the-box integration templates cover many technologies without custom scripting.

Automated resource discovery

Discovers network entities, server resources, and cloud services automatically, then applies monitoring templates to new devices as they come online. Discovery rules cover devices from low-level hardware up to SaaS services, reducing manual onboarding work when infrastructure changes.

Root cause analysis and problem correlation

Correlates incoming problems with existing events in real time to suppress duplicate alerts and identify the root cause. When a network device failure triggers downstream application alerts, Zabbix groups them under the originating problem rather than generating hundreds of separate notifications.

Multi-channel alerting

Sends notifications through Slack, JIRA, Microsoft Teams, email, and SMS when an issue is triggered. Alert actions support proactive notification when an issue starts and post-mortem reporting after resolution, with each notification including the correlated context and affected hosts.

Single pane of glass visualization

Renders collected data as graphs, lists, geomaps, and network topology maps in a single web interface. Dashboards aggregate metrics across multiple data centers and departments, giving operations teams one screen for the full infrastructure state.

Distributed and multitenant monitoring

Monitors remote locations behind firewalls using Zabbix proxies, which relay metrics back to the central server. Multitenancy support lets MSPs and large enterprises segment monitoring by department, region, or client under one Zabbix instance.

strengths · trade-offs

Strengths and trade-offs#

Strengths

  • No per-device licensing costsZabbix is AGPL-3.0 licensed and free to run on your own hardware. Unlike Datadog, PRTG, and SolarWinds NPM, which charge per host, container, or sensor, Zabbix's cost is the server you deploy it on. Monitoring 10 devices or 10,000 devices carries the same software cost.
  • Full-stack infrastructure coverage from one instanceOne instance monitors networks, servers, VMs, containers, cloud services, databases, web applications, and OT equipment through a single interface. This breadth is reflected in 20 years of template development behind the product, as noted on the Zabbix website.
  • Active development with LTS releasesThe GitHub repository shows active commits through November 2026, and version 8.0 LTS added AI-assisted analysis, APM, and OpenTelemetry support. The project has been in continuous development since at least 2014, with a formal partner network and enterprise support contracts available.
  • AGPL-3.0 permits self-hosted commercial useThe AGPL-3.0 license allows self-hosted deployment for any internal purpose, including commercial team use. The license requires distributing source modifications when running a modified version as a network service, but that condition does not apply to teams running unmodified Zabbix as internal infrastructure tooling.

Trade-offs

  • -Multi-component install with database setup requiredZabbix requires installing and configuring a web server, a database, and the Zabbix server process separately. For teams without Linux server administration experience, the initial setup and ongoing maintenance represent real work. The official documentation covers the steps, but the initial setup is longer than a managed SaaS monitoring tool.
  • -Configuration learning curveSetting up discovery rules, trigger expressions, and alert actions requires learning Zabbix's configuration model, which differs from more modern observability tools. Teams migrating from managed Datadog will spend time understanding how triggers, actions, and templates interact before they can operate it confidently.
versus alternatives

Zabbix vs alternatives#

Zabbix vs Datadog

Datadog and Zabbix both cover infrastructure monitoring, APM, and alerting. The primary difference is deployment model and cost structure.

FeatureZabbixDatadog
LicenseAGPL-3.0Proprietary
Self-hostingYesNo
PricingFree (self-hosted)Per-host, per-container billing
APMVersion 8.0+Yes
OpenTelemetryVersion 8.0+Yes

Zabbix is the stronger choice when infrastructure size makes per-host billing unsustainable, when compliance requirements prevent sending telemetry to external services, or when the team has the Linux server skills to operate a self-hosted deployment. Datadog is worth considering when you need a managed experience with tight integration into modern cloud services and no infrastructure to maintain for the monitoring layer itself.

Zabbix vs PRTG Network Monitor

PRTG and Zabbix both monitor networks, servers, and applications. The main difference is licensing model and deployment scale.

FeatureZabbixPRTG
LicenseAGPL-3.0Proprietary
Self-hostingYesYes
PricingFreePer-sensor licensing
Distributed monitoringYes (proxies)Limited
MultitenancyYesLimited

Zabbix is preferable for large-scale deployments and teams that need multitenancy and distributed monitoring via proxies. PRTG covers network devices, servers, applications, and traffic in a single tool and is listed as supporting macOS and Linux systems. PRTG's per-sensor licensing grows expensive at scale; Zabbix's cost stays fixed at the infrastructure needed to run it.

Zabbix vs Nagios XI

Nagios XI is a commercial product built on the open source Nagios Core engine. Both tools monitor servers and network devices, but their approaches differ.

FeatureZabbixNagios XI
LicenseAGPL-3.0Proprietary
Self-hostingYesYes
PricingFreePer-instance licensing
Automated discoveryBuilt-inPlugin-based
Web frontendBuilt-inIncluded

Zabbix's built-in automated discovery, native alerting integrations, and active development make it a stronger choice for new deployments. Nagios XI remains relevant for teams with existing Nagios plugin investments and established workflows. For teams starting fresh, Zabbix covers the same ground without plugin management overhead.

tech stack · detected from GitHub

What it's built on#

Languages
CGoJavaScriptPHP
frequently asked

FAQ#

Is Zabbix free to use?

Yes. Zabbix is AGPL-3.0 licensed and free to download and run on your own infrastructure. There are no per-device fees, no license costs, and no feature limits on the self-hosted version. Zabbix also offers paid enterprise support contracts and professional services for teams that want backed SLAs and configuration help.

Can Zabbix monitor cloud services like AWS and Azure?

Yes. The Zabbix website lists full monitoring capabilities for AWS, Azure, and Google Cloud. The distributed proxy architecture lets Zabbix reach cloud services from an on-premises instance. Out-of-the-box templates cover cloud infrastructure components alongside traditional network and server monitoring.

How does Zabbix compare to Nagios XI?

Nagios XI is a commercial product built on the open source Nagios Core engine, with per-instance pricing. Zabbix is free under AGPL-3.0 and includes automated resource discovery, a built-in web frontend, and native alerting integrations that Nagios achieves through separately maintained plugins. Teams running open source Nagios Core commonly migrate to Zabbix for the web UI and discovery automation.

What notification channels does Zabbix support for alerts?

Zabbix sends alert notifications through Slack, JIRA, Microsoft Teams, email, and text messages when an issue is triggered. This is documented in the GitHub README as one of the out-of-the-box integration options. Alert actions can be configured for both proactive notification when an issue starts and post-mortem reporting after resolution.

Does Zabbix have a SaaS option?

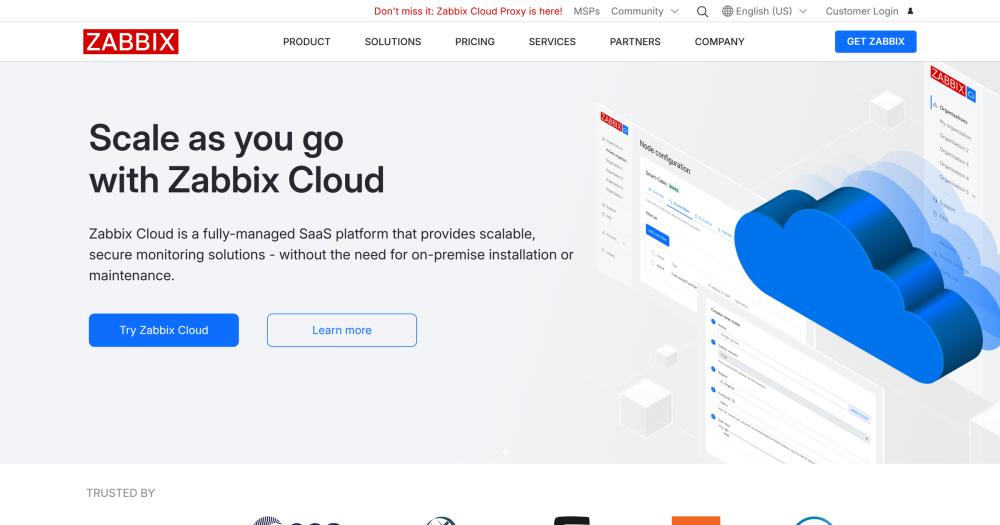
Yes. Zabbix Cloud is a fully managed SaaS platform that provides Zabbix monitoring without on-premises installation or maintenance. It includes scalability on demand and built-in security features. The on-premises self-hosted version remains free under AGPL-3.0 for teams that need full data ownership and control.

also worth a look

Similar open-source tools#

Icinga2

Alternative toDatadog

Self-hosted monitoring server for infrastructure and network checks.

  • 2,247 GitHub stars
  • GPL-3.0Licence GPL-3.0

Checkmk

Alternative toDatadog

Hybrid IT monitoring with auto-discovery and 2,000+ integrations.

  • 2,643 GitHub stars
  • GPL-2.0Licence GPL-2.0

OneUptime

Alternative toDatadog

Uptime, on-call, incidents, logs, and traces; one open source product.

  • 7,809 GitHub stars
  • Apache-2.0Licence Apache-2.0

Apache SkyWalking

Alternative toDatadog

APM platform covering traces, metrics, logs, and AI agent monitoring.

  • 25,004 GitHub stars
  • Apache-2.0Licence Apache-2.0

Uptrace

Alternative toDatadog

Self-hosted APM for distributed traces, metrics, and logs.

  • 4,311 GitHub stars
  • AGPL-3.0Licence AGPL-3.0

ClickStack

Alternative toDatadog

Self-hosted observability stack on ClickHouse with session replay

  • 10,031 GitHub stars
  • MITLicence MIT
by category

Open source tools in these categories#

190

Security & Monitoring

REA (Reverse Engineer Anything), RustDesk, Sherlock
156

IT Management

RustDesk, Immich, Stirling PDF
131

DevOps & CI/CD

Nvm, Uptime Kuma, Netdata
Hostinger

Self-host Zabbix on a Hostinger VPS

Keep it running 24/7, even when your laptop is off. A Hostinger VPS gives it a server of its own.

  1. 01

    Choose a plan

    Starts from $6.49/mo

  2. 02

    Apply

    Extra 10% off yearly plans

  3. 03

    Install Zabbix

    On a server that stays on

  4. 04

    Start building

    Focus on the app, not the server

Deploy on Hostinger

Sponsors

Inbox Zero

Alternative toSuperhuman

AI email assistant that drafts replies and clears your inbox

  • 12,987 GitHub stars
  • AGPL-3.0Licence AGPL-3.0
  • #Email

rakazo

Alternative toGrok Bot

AI teammates you own: your keys, your model, your machine.

  • 7,869 GitHub stars
  • Apache-2.0Licence Apache-2.0
  • #AI Agents

SnitchFeed

Live monitoring on LinkedIn, X, Reddit & more. Agentic social listening for startups.

Marketing & Growth

Advertise your product

New open source projects by email

The projects we add and every new guide. Free, unsubscribe any time.

Find open source alternatives to paid software

/
  • Claude Code to OpenCode
  • Jira to Windshift
  • Notion to AppFlowy
  • Slack to Mattermost
  • Linear to GitLab
  • Wispr Flow to Handy
  • Arc to Zen Browser
  • CapCut to Concat
  • Grok Bot to rakazo
  • Superhuman to Inbox Zero
  • Airtable to AITable
  • Muse to OpenClaw
  • Railway to Coolify
  • GitHub Copilot to Cline
  • Datadog to Netdata
  • Confluence to Wiki.js
  • Discord to Fluxer
  • Microsoft Teams to Rocket.Chat
  • 1Password to KeePassXC
  • Firebase to Supabase
  • Pinecone to Qdrant
  • Zapier to n8n
  • Devin AI to OpenHands
  • Asana to Leantime
  • Claude Code to OpenCode
  • Jira to Windshift
  • Notion to AppFlowy
  • Slack to Mattermost
  • Linear to GitLab
  • Wispr Flow to Handy
  • Arc to Zen Browser
  • CapCut to Concat
  • Grok Bot to rakazo
  • Superhuman to Inbox Zero
  • Airtable to AITable
  • Muse to OpenClaw
  • Railway to Coolify
  • GitHub Copilot to Cline
  • Datadog to Netdata
  • Confluence to Wiki.js
  • Discord to Fluxer
  • Microsoft Teams to Rocket.Chat
  • 1Password to KeePassXC
  • Firebase to Supabase
  • Pinecone to Qdrant
  • Zapier to n8n
  • Devin AI to OpenHands
  • Asana to Leantime