
Game developers debugging rendering artifacts
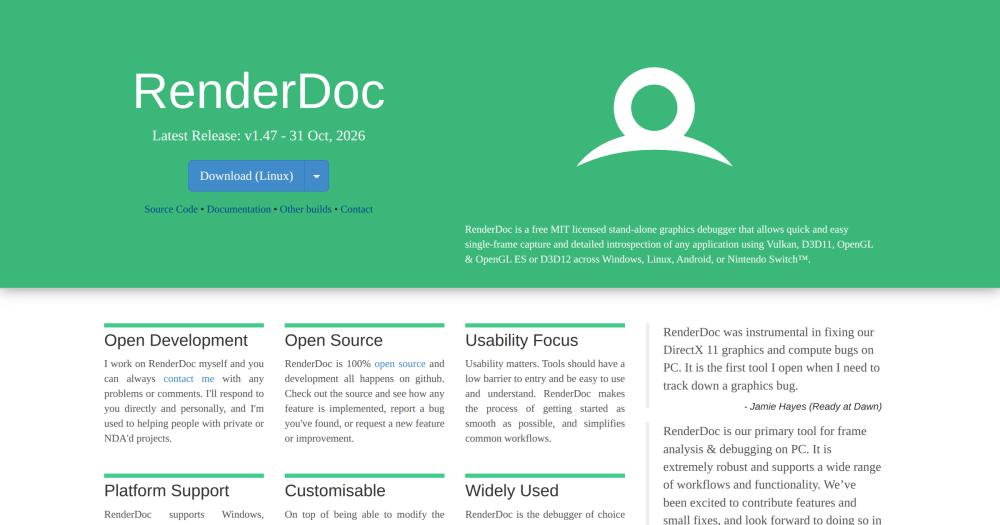
RenderDoc captures the exact frame where an artifact appears and lets you trace the draw call that produced it, inspect the textures and buffers at that point, and step through the responsible shader. Engine integration in Unity and Unreal makes triggering a capture as simple as pressing a button in the editor.
Skip if:
If you need sustained performance profiling, frame pacing analysis, or GPU utilization data over multiple frames, RenderDoc's single-frame model does not cover it. Use a dedicated GPU profiler alongside RenderDoc for that work.


