

Who Statlite is for#
Solo developers monitoring a Spring Boot service on a VPS
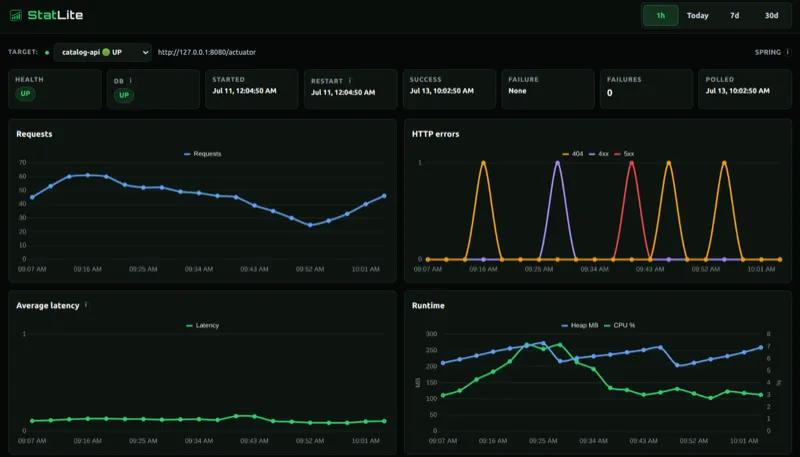
A single developer running one or two Spring Boot services on a 1 GB VPS gets health, traffic, latency, and JVM charts without deploying additional infrastructure. The `inspect --create-config` command detects Actuator endpoints and writes the configuration file automatically.
Skip if:
If your Spring Boot application needs distributed tracing, log aggregation, or alerting to an on-call system, StatLite does not cover those needs.
Small teams running Quarkus or Micronaut services
Teams using Quarkus or Micronaut Micrometer get a focused application dashboard without adding Prometheus and Grafana to their infrastructure. Historical charts for request traffic, latency, CPU, and heap are available from existing endpoint configuration with no additional scrape setup.
Skip if:
Teams running more than a handful of services or requiring per-service alerting will find StatLite's fixed scope too narrow.
Developers adding observability to FastAPI, Express, or Django apps
FastAPI, Express, Django, Go net/http, and Gin applications can expose the StatLite Metrics v1 endpoint using the provided integration guides. StatLite then polls and charts those metrics alongside any JVM targets in the same dashboard with a single binary and configuration file.
Skip if:
If you need arbitrary custom metrics beyond the fixed StatLite Metrics v1 schema, a Prometheus-based setup is more appropriate.
Teams monitoring server resource headroom before scaling
StatLite's self-monitoring target collects CPU, memory, and filesystem capacity from the server it runs on. Teams on a tight VPS allocation can watch whether the host is approaching resource limits before the application is affected, without deploying a separate infrastructure monitoring agent.
Skip if:
If you need multi-server infrastructure monitoring or host metrics across many machines, a dedicated infrastructure monitoring tool is more appropriate.
The problem it solves#
Spring Boot Actuator and Micrometer expose detailed operational data through HTTP endpoints, but raw metric endpoints are not a usable monitoring dashboard. The conventional path is to deploy Prometheus to scrape those endpoints and Grafana to display them, adding two additional services, a time-series database schema, scrape configuration, and ongoing infrastructure maintenance just to answer whether an application is healthy and how much traffic it is handling.
For developers running one or two services on a 512 MB or 1 GB VPS, that stack is disproportionate to the problem. The alternative of paying for a commercial monitoring service adds per-host subscription costs to a project that may handle modest traffic and has no need for fleet-scale alerting, distributed tracing, or log aggregation.
How it solves it#
Spring Boot Actuator Integration
StatLite polls Spring Boot Actuator endpoints for health, traffic, latency, JVM metrics, CPU, and memory without application code changes. The `inspect` command auto-detects available endpoints and writes a target configuration file from a running application's URL, selecting a compatible Micrometer Prometheus endpoint or Actuator JSON automatically.
SQLite-Backed Metric History
All metrics are stored in a local SQLite file on the same server. The dashboard renders historical charts for traffic, latency, CPU, memory, and restart events without any external time-series database. Metric history stays on your own server with no data sent to a third-party service.
Quarkus and Micronaut Support
StatLite collects request, latency, CPU, heap, process, and restart metrics from Quarkus Micrometer and Micronaut Micrometer endpoints natively. SmallRye Health and management health are optional capabilities when the application publishes them. Neither framework requires application code changes beyond standard metrics configuration.
Single Go Binary
StatLite ships as one statically compiled Go binary under 15 MiB idle. There is no JVM runtime, no external database server, and no secondary process to manage. A single YAML configuration file defines the server listen address, SQLite path, polling interval, and one or more application targets.
StatLite Metrics v1 for Non-JVM Frameworks
Applications in any language can expose a fixed JSON endpoint that StatLite polls. Integration guides are provided for FastAPI, Express, Django, Go net/http, and Gin using copyable helpers that add no third-party dependencies to the application. Those helpers make no outbound requests and send no telemetry to PVR Labs.
Host Metrics via Self-Monitoring
StatLite can report its own host's CPU, memory, and filesystem capacity. Spring targets optionally collect host metrics for a remote application's server environment. A dedicated `statlite-self` target provides visibility into the server where StatLite runs alongside application-level metrics.
Strengths and trade-offs#
Strengths
- No External Infrastructure RequiredStatLite bundles its own history store and chart rendering. A complete monitoring setup needs only one binary and one YAML configuration file. The Prometheus and Grafana approach adds two additional services, a time-series database, and scrape configuration that StatLite handles internally with its SQLite store and built-in dashboard.
- MIT License, No Per-Host FeesStatLite is MIT licensed and free to run on any server. There are no subscription tiers, no per-host charges, and no usage limits. Commercial monitoring services like Datadog and New Relic charge monthly per monitored host regardless of traffic volume; StatLite charges nothing beyond the server time the binary uses.
- Built for Resource-Constrained ServersThe binary uses about 15 MiB idle. Low memory, CPU, disk, and operational overhead are documented product constraints, not afterthoughts. The project includes published benchmarks comparing StatLite alongside Spring Boot and Quarkus targets on 512 MB and 1 GB VMs.
- Zero Code Changes for JVM FrameworksSpring Boot, Quarkus, and Micronaut applications need no source code modifications. StatLite works directly against existing Actuator and Micrometer endpoints. The `inspect` command generates a working target configuration from a running application's URL in one step, writing a YAML file only when the path does not already exist.
Trade-offs
- -No Built-In AuthenticationStatLite has no built-in dashboard or API authentication. The README explicitly flags this and recommends running it on a private or protected network, not exposed to the public internet. Remote access requires a reverse proxy that handles authentication or SSH tunneling; there is no configuration option for adding a login.
- -Scoped to Small Deployments OnlyStatLite is designed for one to a few services on a small server. The README names its non-targets explicitly: large fleets, Kubernetes-first infrastructure, arbitrary metrics and dashboards, logs, traces, distributed storage, and complex alerting. Teams whose needs grow beyond a handful of services will migrate to a broader observability tool.
- -Fixed Metric Schema, No Arbitrary Custom MetricsStatLite collects a predefined set of application and host metrics. Unlike Prometheus, which accepts arbitrary metric exposition, the dashboard only shows the concepts its integration targets support. Non-JVM applications can add the StatLite Metrics v1 endpoint, but that endpoint only carries the fixed v1 schema.
Statlite vs alternatives#
StatLite vs Datadog
Datadog and StatLite both collect application health, traffic, latency, and host metrics for JVM services. The key difference is deployment model and scale target. Datadog is a commercial SaaS platform designed for multi-service fleet monitoring across large teams; StatLite is a self-hosted binary for one to a few services on a small server.
| Feature | StatLite | Datadog |
|---|---|---|
| License | MIT | Proprietary |
| Deployment | Self-hosted binary | Managed SaaS + agent |
| Pricing | Free | Per-host per month |
| Metric storage | Local SQLite | Datadog cloud |
| Spring Boot support | Via Actuator endpoints | Via APM agent |
| Authentication | None built-in | Full IAM and RBAC |
StatLite is the better choice when you need health, traffic, and JVM metrics visible on a small VPS with no per-host subscription and no data leaving your server. Datadog is appropriate when you need fleet-scale monitoring, log aggregation, distributed tracing, alerting pipelines, or cross-team dashboards that StatLite does not cover.
StatLite vs New Relic
New Relic offers a similarly broad feature set with a free tier, but it is a managed SaaS platform with a proprietary agent. All metric data is sent to New Relic's cloud infrastructure, which is a privacy consideration for applications handling sensitive traffic.
| Feature | StatLite | New Relic |
|---|---|---|
| License | MIT | Proprietary |
| Deployment | Self-hosted binary | Managed SaaS + agent |
| Data residency | Local server | New Relic cloud |
| Pricing | Free | Free tier, then per-ingest |
| Spring Boot support | Via Actuator endpoints | Via APM agent |
For developers who want all metric history on their own server without a SaaS account, StatLite is the practical choice. New Relic's free tier is worth considering when you need distributed traces, error analytics, or browser monitoring that fall outside StatLite's intentional scope.
Quick start#
Install StatLite with the install script, Homebrew, or Docker.
```bash
curl -fsSL https://raw.githubusercontent.com/PVRLabs/statlite/main/install.sh | sh
brew install pvrlabs/tap/statlite
docker run --rm -p 127.0.0.1:9090:9090 docker.io/pvrlabs/statlite:latest
```What it's built on#
- Languages
- GoJavaScriptPython
- Frameworks
- DjangoExpressFastAPI
- Databases
- SQLite
FAQ#
Does StatLite require Prometheus or Grafana to run?
No. StatLite stores all metric history in a local SQLite file and renders its own dashboard. Prometheus and Grafana are not required and are not dependencies. If you already run a Prometheus and Grafana stack, you do not need StatLite alongside it.
Does StatLite support Quarkus and Micronaut, or only Spring Boot?
StatLite natively supports Spring Boot Actuator, Quarkus Micrometer, and Micronaut Micrometer with no application code changes required beyond standard metrics configuration. Applications in other languages and frameworks, including FastAPI, Express, Django, and Go, can add support through the StatLite Metrics v1 endpoint using the provided integration guides.
Is there built-in authentication for the StatLite dashboard?
No. StatLite has no built-in dashboard or API authentication. The project documentation recommends running it on a private or protected network only. Remote access should go through a reverse proxy that handles authentication, or via SSH port forwarding. The README flags this explicitly under server and access guidance.
What is the minimum server size StatLite can run on?
StatLite uses about 15 MiB idle and is built for resource-constrained servers. The project documentation includes benchmarks comparing StatLite running alongside Spring Boot and Quarkus targets on a 512 MB VM. Low memory, CPU, disk, and operational overhead are documented product constraints.
Is StatLite suitable for monitoring a large number of services?
StatLite is intentionally designed for one to a few services on a small server. The README explicitly lists large fleets, Kubernetes-first infrastructure, distributed storage, logs, traces, and complex alerting as scenarios StatLite is not built for. For those cases, a broader observability tool such as Prometheus with Grafana, or a commercial platform, is the appropriate choice.
Similar open-source tools#

Oxynote
214 GitHub starsTechnical wiki with live metrics, draft reviews, and real-time editing
Alternative to Notion

Bifrost
8,894 GitHub starsOpen-source AI gateway with 23+ providers, failover, and MCP support.
Alternative to Portkey

Keda
10,642 GitHub starsEvent-driven Kubernetes autoscaling with 70+ scalers and scale to zero
Alternative to Kedify

ship-safe
860 GitHub starsSecurity scanner for AI agents, MCP servers, and LLM codebases.
Alternative to Snyk

Sentry
2,216 GitHub starsReal-time error tracking with performance monitoring and traces
Alternative to Rollbar

ProjectDiscovery
32,080 GitHub starsOpen source security tools for finding vulnerabilities at scale
Alternative to Qualys