
Open-source alternatives guide
Open Source Datadog Alternatives: 9 Self-Hosted Picks
By SurajReviewed Verified
I compared 9 open source Datadog alternatives you can self-host, for teams whose per-host and per-GB Datadog bill is what sends them looking. The best open source alternative to Datadog is SigNoz because it covers metrics, traces, logs and infrastructure monitoring in one self-hosted product built natively on OpenTelemetry, with its community code under the MIT licence, and a Datadog Receiver keeps the Datadog Agent forwarding data while you move.
For Kubernetes with eBPF auto-discovery, Coroot. For infrastructure and network monitoring, Zabbix. For teams already running Prometheus, the Grafana stack. For uptime, on-call and telemetry together, OneUptime.
Which one fits depends on which Datadog products you use today and how many services your team is ready to run.
TL;DR
- SigNoz: APM, logs, traces and infrastructure monitoring in one self-hosted product, with a Datadog Receiver so the move can be incremental.
- Coroot: Kubernetes visibility through eBPF, with metrics, logs, traces and profiles captured with zero code changes.
- Zabbix: infrastructure and network device monitoring, 100% free and open source under AGPL-3.0.
Overview
What Datadog is and what it costs
Datadog covers logs, metrics and traces in one platform, rated 4.4 out of 5 from 749 reviews on G2, with over 1,000 integrations and APM support for Java, Python, Ruby, Go, Node.js, .NET and PHP. The free tier gives you up to 5 Basic hosts with 1-day metric retention, and paid plans hold full-resolution metrics for 15 months. The Datadog Agent is open source, so you can audit what the collection layer sends. Datadog is a SaaS platform, so check whether that fits your data-residency needs before you stay.
Pricing runs per host and per GB. Infrastructure Pro is $15 per host per month billed annually. APM is $31 per APM host per month billed annually when Infrastructure Monitoring is attached, and that includes 150 GB of span ingestion and 1 million indexed spans per APM host per month.
Log ingestion is $0.10 per GB regardless of billing period. Infrastructure Pro gives you 100 custom metrics per host, and Infrastructure Enterprise at $23 per host gives you 200.
DevSecOps Pro is $22 per host per month billed annually and covers conformance tracking for over 15 industry benchmarks, including CIS, PCI DSS, and SOC 2. Check whether your team relies on that conformance tracking before you switch.
Datadog lists over 1,000 integrations, and running the equivalent in Grafana means operating several separate services. How much migration work you face scales directly with how many of those integrations your team actively uses.
Staying is the right call in 3 situations: you're tracking conformance across more than 15 benchmarks, your active integration count makes self-hosting management costlier than the Datadog bill, or your team has no capacity to operate a replacement.
Pain points
Why people leave Datadog
The practical reasons teams compare Datadog with open-source alternatives before they migrate.
Datadog's own billing docs explain the mechanism: host count is metered hourly and billed at the high-water mark of the lower 99% of those hourly readings. Each new host on Infrastructure Pro adds $15 per month billed annually, and each host that also generates traces adds $31 per month for APM, before logs.
Log ingestion adds $0.10 per GB on top of that. A service that logs at any real volume turns a moderate host bill into a large one quickly. Infrastructure Pro allots 100 custom metrics per host across the account. Database Monitoring costs $70 per database host per month billed annually, billed separately from the host monitoring.
Infrastructure Pro plus APM comes to $46 per host per month billed annually ($15 + $31). At 20 hosts that is $920 a month, or $11,040 a year, before logs.
Each pick's cheapest paid plan and the machine a self-hosted install asks for:
| Tool | Paid plan from | Self-hosted requirement |
|---|---|---|
| SigNoz | From $49/month (includes $49 usage) | Docker with 4 GB memory minimum |
| Grafana stack | Grafana Cloud free tier, paid plans above it | Grafana: 512 MB RAM and 1 CPU core minimum, plus a MySQL 8.0+ or PostgreSQL 12+ database. Prometheus, Loki and Tempo run as separate projects |
| OpenObserve | $0.50/GB ingested with annual commitment, plus $0.01/GB queried | Single binary, no cluster setup |
| ClickStack | HyperDX Starter: $20/month (50 GB) | Docker, 4 ports |
| Coroot | Standard, self-hosted: $1 per monitored CPU core/month | Linux kernel 4.16 or later |
| Uptrace | Cloud: 50 GB free every month, then from $0.075/GB | ClickHouse + PostgreSQL + Redis |
| Apache SkyWalking | None, the Apache-2.0 software is free | Docker with ElasticSearch or BanyanDB as storage |
| OneUptime | Growth: $20/user/month (annual) | Linux with 8 GB memory |
| Zabbix | No paid edition of the software. Zabbix sells technical support and offers Zabbix Cloud with a 5-day free trial | UNIX server required, Docker and VM appliance installs available |
None of the tools below charges a Datadog-style per-host fee. Coroot charges per CPU core and OneUptime charges per user and per monitor.
At a glance
Quick comparison
| Name | License | Best For |
|---|---|---|
| SigNoz | MIT | closest all-in-one Datadog APM and log replacement |
| Grafana | AGPL-3.0 | composable observability for teams already on Prometheus |
| OpenObserve | AGPL-3.0 | single-binary observability with RUM and session replay |
| ClickStack | MIT | ClickHouse-native logs and traces with MCP agent access |
| Coroot | Apache-2.0 | eBPF-based Kubernetes visibility with zero instrumentation changes |
| Uptrace | AGPL-3.0 | OpenTelemetry APM on flat per-edition self-hosted pricing |
| Apache SkyWalking | Apache-2.0 | ASF-governed APM for cloud native and AI agent workloads |
| OneUptime | Apache-2.0 | uptime and on-call plus OpenTelemetry telemetry in one product |
| Zabbix | AGPL-3.0 | infrastructure and network monitoring under AGPL-3.0 |
APM and traces
APM, $31 per APM host per month billed annually
SigNoz, Uptrace, Apache SkyWalking
Infrastructure and metrics
Infrastructure Monitoring, Pro at $15 per host per month billed annually
Grafana and Prometheus, Zabbix, Coroot
Log management
Log Management, $0.10 per GB ingested
OpenObserve, ClickStack (logs and traces)
Synthetics and on-call
Synthetic Monitoring and On-Call
OneUptime
Real user monitoring and session replay
Real User Monitoring and Session Replay
OpenObserve, ClickStack
Error tracking
Error Tracking
SigNoz, ClickStack
Network devices
Network Device Monitoring
Zabbix
Profiling
Continuous Profiler
Coroot
Editorial ranking
9 Best Open Source Datadog Alternatives (Ranked)

- 32.6K stars
- MIT
- Active this week
- Last commit 2 days ago
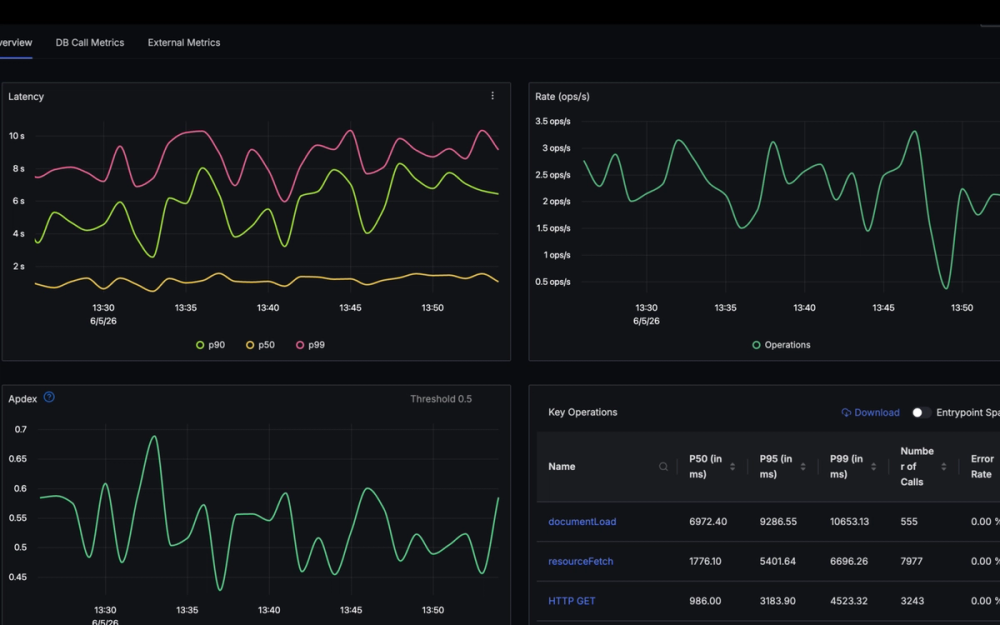
SigNoz covers metrics, traces, logs and infrastructure monitoring in one self-hosted product, built natively on OpenTelemetry. The specific feature that makes the migration incremental is a Datadog Receiver in the OpenTelemetry Collector: the existing Datadog Agent keeps forwarding data to SigNoz while you change your applications one signal type at a time.
Read moreShow lessKey Features · Pros · Cons · License & Hosting · Best For
The community edition is free and runs on your own infrastructure. The Cloud Teams plan starts at $49 per month, which includes $49 of usage, billed at $0.30 per GB ingested for logs and traces and $0.10 per million metric samples, with no per-host and no per-user fees on SigNoz Cloud. A team running 20 services on 20 hosts pays the same as one running 20 services on 2 hosts, because the meter follows data volume, not infrastructure count.
Key Features
- APM covering P99 latency, Apdex, database calls and external calls per service
- Infrastructure monitoring for Kubernetes, hosts and cloud metrics alongside every service
- Alerts on metrics, logs, traces, exceptions, anomaly detection and Apdex, routed to Slack, PagerDuty, Opsgenie, MS Teams, email or webhooks
- MCP server for bringing telemetry into AI coding agents, plus a cloud-only AI teammate for incident investigation and alert tuning
Pros
- No per-host and no per-user pricing on SigNoz Cloud means the bill follows data volume rather than host or seat count
- OTel-native from the start, so there are no proprietary agent formats to migrate away from later
- Cloud is SOC2 Type II and HIPAA compliant, with data centers in the US, EU and India
Cons
- Self-hosted community edition means your team handles storage and upgrades for the backend, and that is engineering time Datadog does not ask for
- Cloud Enterprise starts at $4,000 per month, so compliance-heavy teams should factor that into the comparison before assuming the per-GB pricing is the whole story
- The MIT licence covers code outside the
ee/andcmd/enterprise/directories, and code inside those directories is under a separate enterprise licence, so inspect those paths before assuming the entire binary is MIT
License & Hosting
- License: MIT for community code outside the
ee/andcmd/enterprise/directories. Code in those directories is under a separate enterprise licence. Modify and self-host the community code freely. - Where it runs: self-hosted on Docker, Kubernetes or Linux, or on SigNoz Cloud
- Setup: Docker Compose with Docker Engine 20.10+ and at least 4 GB memory. Kubernetes and Linux binary installs documented separately
- Costs: community edition costs only the VPS or cluster it runs on. Cloud Teams plan from $49/month including usage. Cloud Enterprise from $4,000/month
Best For
I'd start with SigNoz when the team needs APM, distributed tracing, log management and infrastructure monitoring in one product and wants a migration path that does not require cutting over from Datadog all at once. The Datadog Receiver keeps both platforms running during the transition. For teams whose primary need is uptime and on-call without APM, OneUptime covers that job and adds status pages and incident timelines in one product.

- 77.9K stars
- AGPL-3.0
- Active this week
- Last commit today
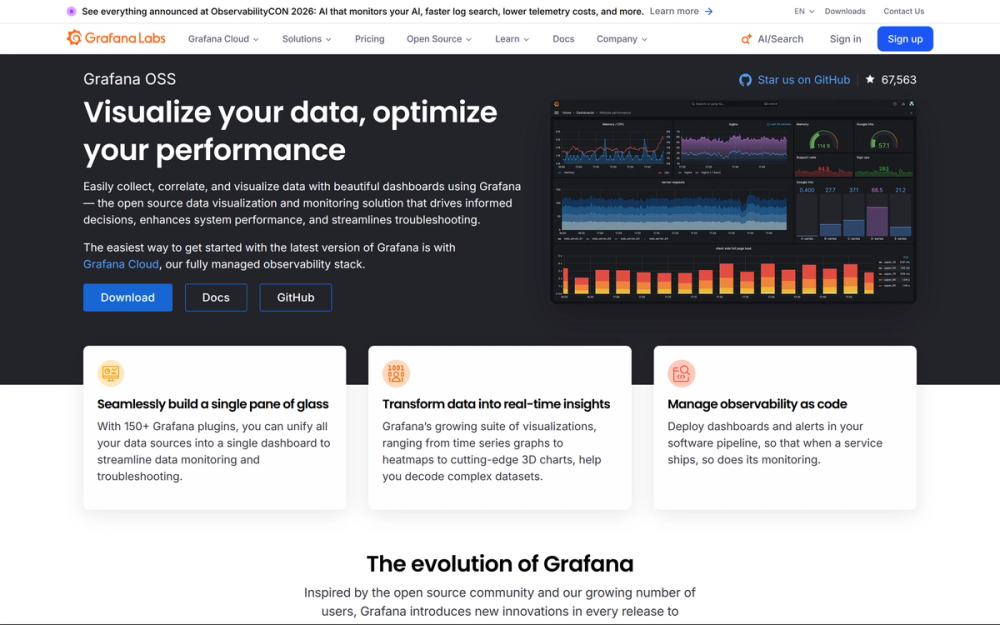
Grafana is the dashboard and alerting layer for Prometheus, Loki and Tempo. Prometheus is the de facto standard for metrics-based observability in Kubernetes environments and the second project after Kubernetes to graduate from the CNCF. If you already run Prometheus scraping workloads, adding Loki for logs and Tempo for traces extends what you have rather than replacing it.
Read moreShow lessKey Features · Pros · Cons · License & Hosting · Best For
The honest trade-off is that this is several projects run together, not 1 binary. The Grafana OSS ecosystem covers metrics (Prometheus, Mimir), logs (Loki), traces (Tempo), profiling (Pyroscope), frontend observability (Faro), load testing (k6), and OpenTelemetry collection via Alloy. Teams leave Datadog for Prometheus and Grafana, then find themselves running a Prometheus cluster. Far cheaper, and far more work.
Key Features
- Prometheus: multi-dimensional data model, PromQL query language, HTTP pull model for metrics collection, designed for reliability as the system to consult during an outage
- Loki: horizontally scalable log aggregation, indexes only labels rather than full log text, 100% persistence to object storage for petabyte-scale storage
- Tempo: distributed tracing backend requiring only object storage, ingests Jaeger, Zipkin and OpenTelemetry trace formats
- Mimir: scales to 1 billion active series with high availability and multi-tenancy
- Grafana Alloy: open source OpenTelemetry collector with built-in Prometheus pipelines
- Grafana Cloud free tier: 10,000 Prometheus metrics, 50 GB logs, 50 GB traces and 500 VUh k6 testing at no cost
Pros
- No per-host fees on any component: Prometheus, Loki, Tempo and the Grafana OSS stack are free open source projects
- Grafana Cloud's free tier is a real starting point, not a trial limit
Cons
- Grafana is AGPL-3.0. Running it for your own team asks nothing of you. If you change the code and offer it to others over a network, you share your changes.
- You run Prometheus, Loki, Tempo and Grafana as separate projects, each with its own storage, scaling and upgrade path, and that operational cost is real and grows with usage
- Prometheus is not suitable when 100% accuracy is needed, such as for per-request billing, because the collected data may not be detailed and complete enough
- Grafana requires a database: MySQL 8.0+ or PostgreSQL 12+ for production. SQLite is not recommended for production.
License & Hosting
- License: Grafana is AGPL-3.0. Prometheus is Apache-2.0. Apache-2.0 is permissive.
- Where it runs: self-hosted on Debian, Ubuntu, RHEL, Fedora, SUSE, macOS or Windows, or via Grafana Cloud (hosted managed option)
- Setup: Grafana minimum is 512 MB RAM and 1 CPU core. Requires a production database (MySQL 8.0+ or PostgreSQL 12+).
- Costs: OSS components cost only their infrastructure. Grafana Cloud has a free tier and paid plans above it.
Best For
The Grafana and Prometheus stack suits teams already running Prometheus on Kubernetes who want to extend to logs and traces without learning new query languages for metrics. Loki uses LogQL for log queries, which is its own language to pick up. For teams who want 1 binary to operate rather than multiple services, OpenObserve covers that job.

- 23K stars
- AGPL-3.0
- Active this week
- Last commit 2 days ago
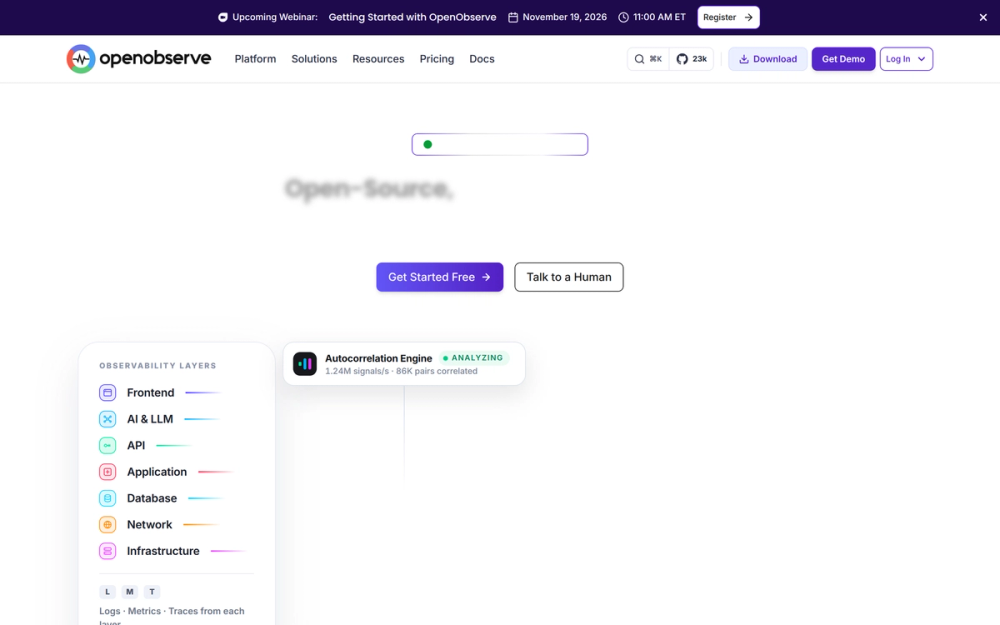
OpenObserve runs as a single binary and covers logs, metrics, traces, RUM, session replay and AI/LLM observability in one place. That is the direct contrast with the Grafana stack, which is several projects run together. The binary is up in under 2 minutes with no cluster setup, and OpenObserve is built in Rust.
Read moreShow lessKey Features · Pros · Cons · License & Hosting · Best For
The storage design is the other sharp difference. OpenObserve says Parquet columnar storage on an S3-native backend cuts storage costs by up to 140x against Elasticsearch, and it runs in production in environments processing in excess of 5 PB/day. All ingested data is immutable: once it is in, only entire retention periods can be dropped, not individual records. Teams with a compliance requirement for immutable audit data get that by default. Teams who need to delete a misconfigured ingestion run do not get what they want.
Key Features
- Logs, metrics, traces, RUM, dashboards, alerts, pipelines and AI observability in one binary
- SQL for logs and traces, SQL or PromQL for metrics, no proprietary query language
- Parquet columnar storage on an S3 backend
- OpenTelemetry native with no vendor lock-in
- Auto-correlation engine linking logs, metrics, traces, RUM, session replay and LLM calls into a single session
- AI SRE agent for incident triage, root cause correlation and postmortem drafting
Pros
- No per-host, per-seat or per-user fees: pricing charges only for what is ingested and queried
- Single binary with Docker one-liner install keeps operational overhead low
- SOC 2 Type II and ISO 27001 certified, GDPR compliant, HIPAA ready with BAA on Enterprise contracts
Cons
- Enterprise Edition is under a commercial Enterprise License Agreement, not AGPL: teams that need enterprise SSO (OIDC, OAuth, SAML 2.0, LDAP/AD) or federated search must move to that licence
- Cloud Professional charges $0.50 per GB ingested with annual commitment, plus $0.01 per GB queried, and at high query rates the query fee adds up
License & Hosting
- License: AGPL-3.0 for the open source edition, the same terms as Grafana (see How to choose). The Enterprise Edition is under a separate commercial Enterprise License Agreement, not AGPL.
- Where it runs: self-hosted as a single binary or Docker container, or on OpenObserve Cloud
- Setup: single Docker command using the public ECR image, no complex cluster setup required
- Costs: self-hosted open source edition costs only its infrastructure. The free tier includes up to 50 GB/day of ingestion. Cloud Professional at $0.50/GB ingested with annual commitment, plus $0.01/GB queried
Best For
OpenObserve fits when you want one binary covering logs, metrics, traces and RUM with per-GB pricing and no per-host fees. If frontend observability matters alongside backend telemetry, the built-in RUM and session replay mean you are not stitching in a separate tool. Fine-grained data deletion is not possible once data is ingested, and if your workflows depend on it, ClickStack covers logs and traces well and adds Lucene search syntax if that is the query pattern you prefer.

- 10K stars
- MIT
- Active this week
- Last commit 1 day ago
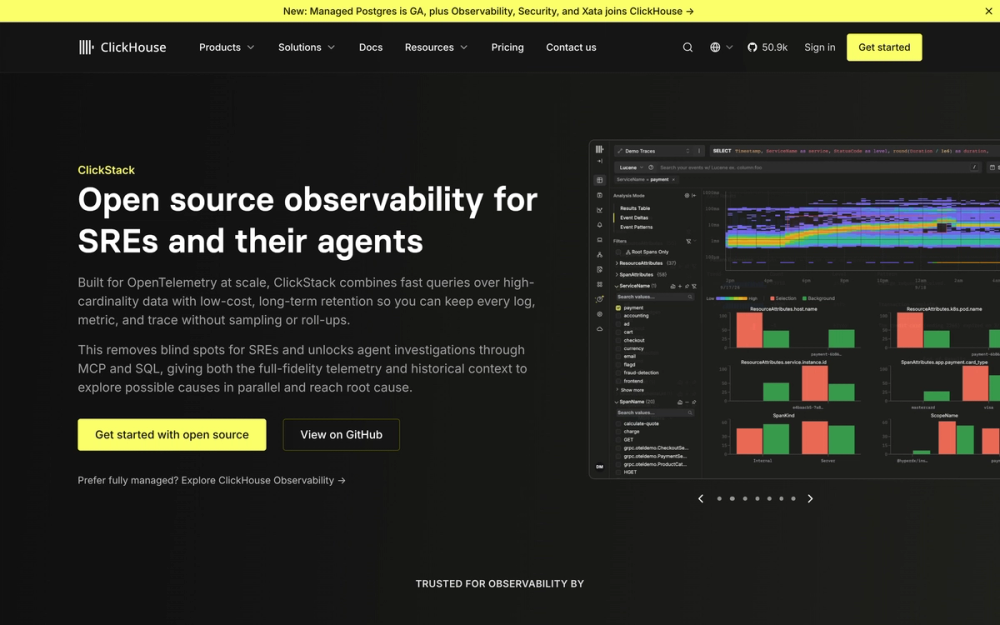
ClickStack builds on ClickHouse for every part of the observability job: logs, metrics, traces and session replays collected via OpenTelemetry, stored and queried in ClickHouse, surfaced in a UI you can run yourself. HyperDX sells hosted plans for it. ClickHouse also offers a managed observability service.
Read moreShow lessKey Features · Pros · Cons · License & Hosting · Best For
The part worth noting is the MCP server. Compatible agents can query telemetry, discover sources, and manage saved searches, dashboards and alerts over MCP. ClickHouse's own benchmark reports that agents using ClickStack's purpose-built MCP tools were 17% more accurate, made 25% fewer tool calls and were 2.7x more consistent than agents using a generic ClickHouse MCP server.
Key Features
- Logs, metrics, traces and session replays on ClickHouse
- Full-text search with Lucene-style syntax or SQL, with inverted indexes on log bodies and attributes and Bloom filter indexes on high-cardinality columns such as trace IDs
- MCP server for AI agent access to telemetry, saved searches, dashboards and alerts
- Schema-flexible UI: supports existing ClickHouse telemetry tables with custom field mappings, not only the OTel schema
- All-in-one Docker image bundling ClickHouse, the UI, the OTel Collector and MongoDB for local evaluation
Pros
- MIT licence on the UI and Apache-2.0 on ClickHouse and the OTel Collector: permissive for commercial use with no source-disclosure requirement
- Lucene-style log search is familiar to teams coming from Kibana or Elasticsearch
- ClickHouse reports 10 to 30x OpenTelemetry compression rates for ingestion and storage
- Hosted HyperDX Starter plan at $20/month covers 50 GB with unlimited users, a concrete comparison point against Datadog's per-host meter
Cons
- The standard open source deployment uses MongoDB to store dashboards, alerts and user profiles alongside ClickHouse: 2 database systems to operate, not 1
- Self-hosting ClickStack is MIT and Apache 2.0 software. You pay for the machines, and your team owns capacity planning, security, backups, upgrades and performance tuning for all components
- ClickStack collects anonymized usage data by default. Opt out by setting
USAGE_STATS_ENABLED=false
License & Hosting
- License: UI is MIT. ClickHouse and the OpenTelemetry Collector are Apache-2.0. Both are permissive for commercial self-hosting.
- Where it runs: self-hosted via Docker, or hosted on HyperDX cloud (hyperdx.io)
- Setup: Docker with 4 ports available: 8080 (UI), 4317 (OTLP gRPC), 4318 (OTLP HTTP), 8123 (ClickHouse HTTP)
- Costs: self-hosted ClickStack is MIT and Apache 2.0 software. You pay for the machines. HyperDX hosted Starter at $20/month for 50 GB, $0.40/GB above that. Enterprise at custom pricing
Best For
Start with ClickStack when the team already runs ClickHouse or needs log and trace search with Lucene syntax and AI agent tooling over MCP. The schema-flexible UI is also useful when you have existing ClickHouse telemetry tables in custom schemas. Skip it if the team needs a single binary with no secondary databases: OpenObserve covers that job.

- 8K stars
- Apache-2.0
- Active this month
- Last commit 8 days ago
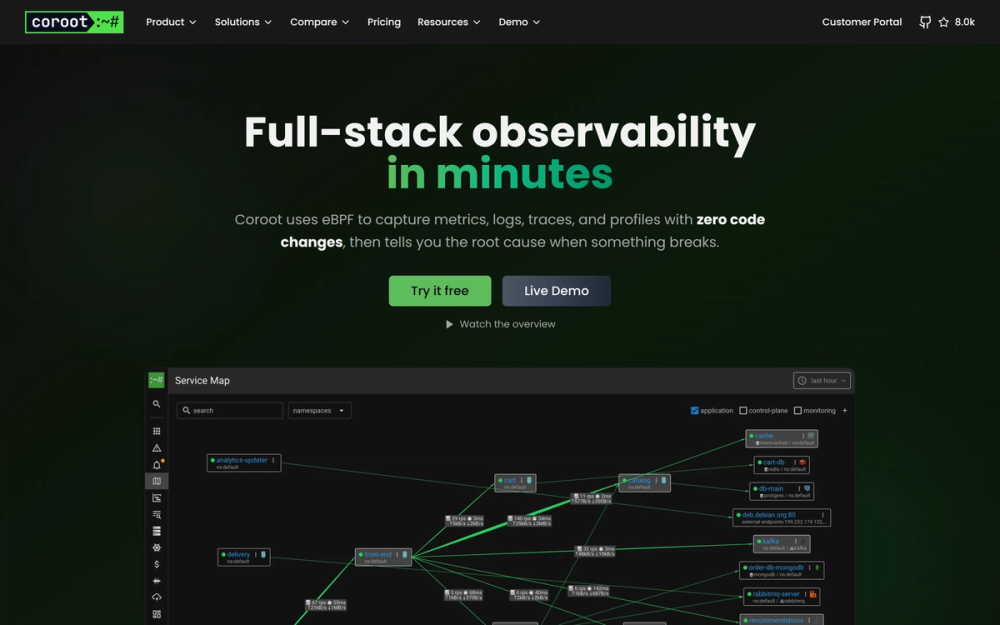
Coroot offers service maps, SLOs and continuous profiling with zero code changes to the application, for teams on Kubernetes that have not yet instrumented services with OTel. It uses eBPF to pull metrics, logs, traces and profiles straight from the kernel, then points you at the root cause when something breaks.
Read moreShow lessKey Features · Pros · Cons · License & Hosting · Best For
Check your kernel version before you deploy. Coroot requires Linux 4.16 or later, and Docker-in-Docker environments like MiniKube aren't supported.
Key Features
- eBPF-based automatic capture of metrics, logs, traces and profiles with no application code changes
- Continuous profiling down to the precise line of code for CPU and memory spikes
- SLO tracking, smart alerting and AI-powered root cause analysis
- Deployment tracking and cost monitoring
- Kubernetes Operator, OpenShift, Docker, Docker Swarm, Amazon ECS on EC2, Ubuntu/Debian, RHEL/CentOS and Windows install targets, with EKS (including basic AWS Fargate support), GKE, AKS, OKE, K3s and MicroK8s all supported
Pros
- Zero instrumentation changes means a team can get service maps and dependency graphs without touching application code
- Apache-2.0 community edition is free and covers core features with no licence fee
- Self-hosted, so data stays within your own infrastructure
- 14-day free trial with no credit card and full feature access
Cons
- Linux kernel 4.16 or later is required, so teams on older kernels are out
- eBPF does not work in Docker-in-Docker (MiniKube) or WSL1, so your local dev environment may not match production
- Standard plan costs $1 per monitored CPU core per month. A 20-core cluster runs $20/month, predictable but not free once the fleet grows
- Enterprise Premium pricing requires contacting sales
License & Hosting
- License: Apache-2.0 for the community edition. Permissive for commercial self-hosting with no source-disclosure requirement.
- Where it runs: self-hosted on Kubernetes, Docker, Amazon ECS, bare metal Linux or Windows
- Setup: Kubernetes, Kubernetes Operator, OpenShift, Docker, Docker Swarm or Linux package. Requires Linux kernel 4.16+
- Costs: community edition costs only infrastructure. Standard plan at $1 per monitored CPU core/month. Enterprise Premium at custom pricing
Best For
Coroot makes sense when the team runs Kubernetes and wants automatic service maps, SLOs and continuous profiling without touching application code. eBPF handles the observation at the kernel level, so no instrumentation changes are needed in the services themselves. Verify your kernel version before committing, and confirm that managed Kubernetes clusters you use meet the requirement. For non-Kubernetes mixed fleets, Zabbix covers more ground.

- 4.3K stars
- AGPL-3.0
- Active this month
- Last commit 22 days ago
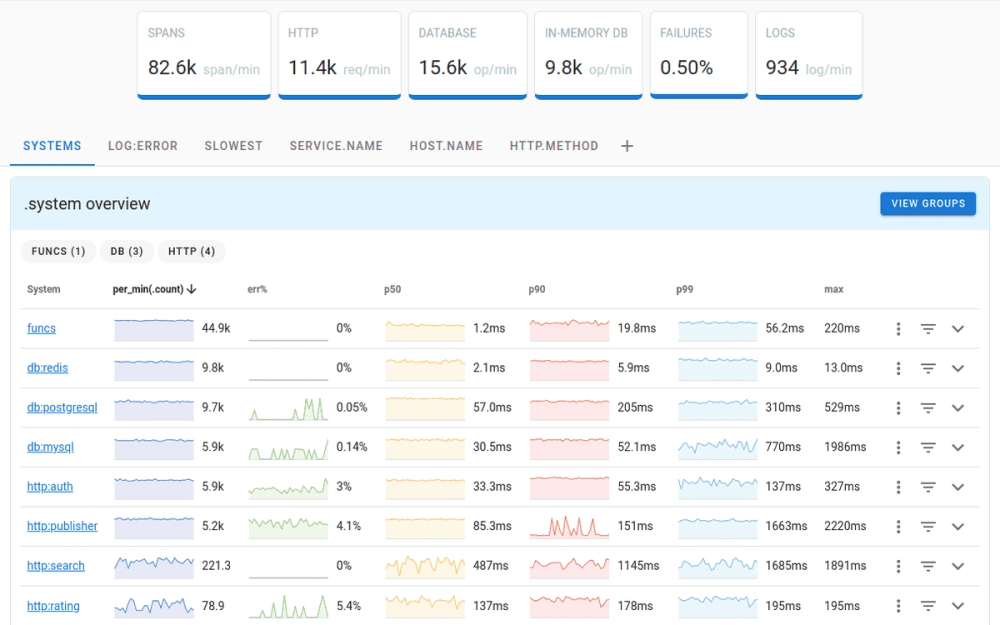
Uptrace is an open source APM built on OpenTelemetry, for traces, metrics and logs. Self-hosted, it is priced per edition, a flat monthly fee per daily volume. Uptrace Cloud is billed per GB.
Read moreShow lessKey Features · Pros · Cons · License & Hosting · Best For
Uptrace requires ClickHouse (version 26.3 or later) for telemetry storage, PostgreSQL for metadata such as metric names and alerts, and Redis for caching. For smaller teams, that dependency chain is the real setup cost to weigh.
Key Features
- OpenTelemetry APM covering traces, logs and metrics ingested from OpenTelemetry, Prometheus, Vector, FluentBit, CloudWatch and more
- 12 supported languages: Go, Python, Ruby, Node.js, .NET, Java, Erlang, Elixir, Rust, PHP, C++ and Swift
- SAML and OIDC single sign-on documented for Google, Okta and Keycloak
- Alerting with notifications by email, Slack, webhook and AlertManager
- Flat self-hosted edition pricing: Community at $0 forever, Starter at $39/month (up to 50 GB/day), Team at $199/month (up to 200 GB/day), Business at $499/month (up to 500 GB/day)
Pros
- Self-hosted editions use flat pricing per daily volume, so the bill does not grow with every gigabyte ingested
- Uptrace Cloud has no host or seat limits, so services, users and hosts can be added freely
Cons
- AGPL-3.0 licence, the same terms as Grafana (see How to choose). Check with legal for managed-service use cases.
- Requires ClickHouse 26.3+, PostgreSQL and Redis: 3 stores to provision, back up and upgrade. Not a single-binary install
- Community edition retains data for only 14 days. Starter and above extend retention, and $39/month is the floor for teams that need longer history.
- Uptrace Cloud data is stored in EU data centers (Germany and Finland) only. Teams with US or APAC data-residency requirements must self-host.
License & Hosting
- License: AGPL-3.0.
- Where it runs: self-hosted via Docker, Ansible playbook or Kubernetes Helm chart, or on Uptrace Cloud (EU data centers)
- Setup: Docker for quick start (ClickHouse + PostgreSQL pre-configured), Ansible for bare metal, Helm chart for Kubernetes
- Costs: Community edition costs only infrastructure. Starter $39/month self-hosted.
Best For
I'd pick Uptrace when the team wants OpenTelemetry APM at a flat monthly rate on self-hosted rather than a per-GB meter that climbs with volume. The flat model pays off fast at high ingestion: on the Team tier at $199/month, 200 GB/day costs the same as 10 GB/day. Teams not already comfortable operating ClickHouse will find OpenObserve's single binary a better starting point.

- 25K stars
- Apache-2.0
- Active this week
- Last commit 1 day ago
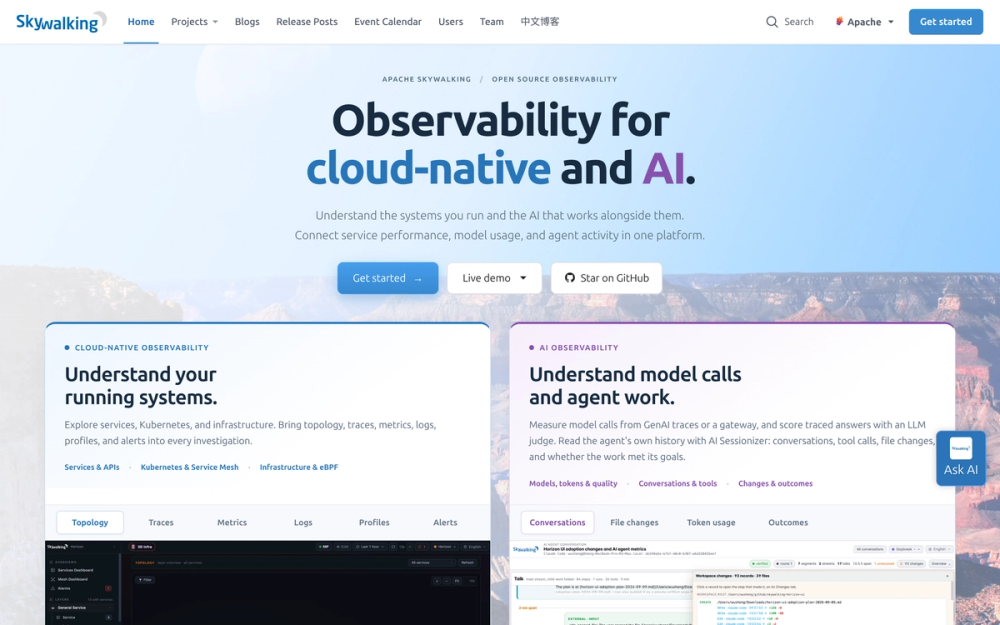
Apache SkyWalking is an open source APM platform covering tracing, metrics, logging, profiling and events for cloud native environments. It is an Apache Software Foundation project under Apache-2.0, has more than 1,000 contributors, and has been in production for over 10 years. It also includes an AI Sessionizer that reads conversation history, tool calls and file changes from Claude Code, Kiro and LangChain/LangGraph agents.
Read moreShow lessKey Features · Pros · Cons · License & Hosting · Best For
Key Features
- Auto-instrument agents for Java, C#, Node.js, Go, PHP and Python. Manual SDKs for C++, Rust and Nginx LUA
- Service mesh receiver for Istio/Envoy telemetry
- AI assistant (Horizon) for querying system health with charts, topology, traces and logs
- MCP server for investigation tools and observability data from a desktop or terminal
- Multiple storage backends: ElasticSearch, H2, MySQL, TiDB, BanyanDB
- eBPF stack for Kubernetes monitoring
Pros
- Apache-2.0 licence is permissive for commercial use, modification and distribution with no source-disclosure requirement
- Apache Software Foundation project governance means stable open-source stewardship
- OpenTelemetry, Prometheus, Zipkin, Telegraf and Zabbix integrations for existing telemetry pipelines
Cons
- Storage backend selection adds complexity: the logically split architecture (Probes, Platform backend, Storage, UI) means more moving parts than a single-binary tool
License & Hosting
- License: Apache-2.0. Permissive for commercial use with no source-disclosure requirement.
- Where it runs: self-hosted. Docker one-liner script starts ElasticSearch or BanyanDB, the OAP server and Booster UI
- Setup: Docker with one-liner script for ElasticSearch or BanyanDB as storage. Multiple components (OAP server, storage, UI) to manage
- Costs: software is free. Infrastructure for storage (ElasticSearch or BanyanDB) and OAP server is the ongoing cost
Best For
Apache SkyWalking is the call when the team needs APM with broad language support and Apache Software Foundation governance, or when AI agent session monitoring is a first-class requirement: the AI Sessionizer tracks what an agent did, which tools it called and whether it met its goals. Teams that want a single binary or a hosted option will find OpenObserve covers both, and SigNoz Cloud covers the hosted option.

- 7.8K stars
- Apache-2.0
- Active this week
- Last commit 3 days ago
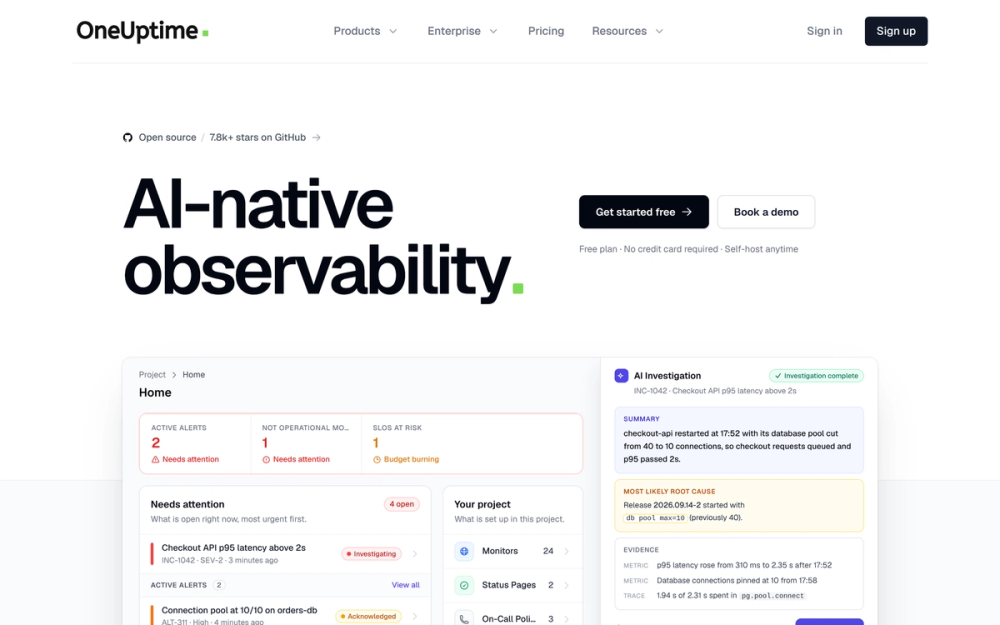
OneUptime is what teams use in place of separate tools like Pingdom, Statuspage, PagerDuty, Datadog and Sentry. Monitoring, logs, metrics, traces, on-call, incident management and status pages all live in one place. Where the Grafana stack is several projects run together, OneUptime gives you one product to configure.
Read moreShow lessKey Features · Pros · Cons · License & Hosting · Best For
The community edition includes SAML and OIDC single sign-on and costs nothing beyond your own infrastructure. On-call rotation and alerts sit behind the Growth plan, which starts at $20 per user per month billed annually.
Key Features
- Monitoring for websites, APIs, ports, DNS and certificates from probes worldwide or from inside a private network, plus servers, Kubernetes, Docker, VMware, databases and network devices
- On-call paging by phone, SMS, email, push, Slack or Teams, with escalation until someone responds
- OpenTelemetry telemetry: logs, metrics, traces, exceptions, profiles and RUM in one place
- AI incident investigation with read-only root cause analysis and optional pull request creation for fixes
- MCP server for Claude, Cursor, VS Code with GitHub Copilot or any MCP client
- Status pages with 1 page and 100 subscribers on Free. Unlimited on Growth and above
Pros
- Apache-2.0 community code (outside the
ee/directory), permissive for self-hosting with no source-disclosure requirement - One product that covers monitoring, on-call, incident management and log and trace collection, so there is one less integration surface to maintain
- Air-gapped deployment is supported with signed images, offline enterprise licence activation and no CDN dependencies, which matters for teams in regulated or network-restricted environments
- Telemetry ingest priced at $0.10/GB across all plans
Cons
- On-call rotation and alerts are behind the Growth plan ($20/user/month annual), so teams that need only on-call pay per user, which scales differently from per-GB tools
- Enterprise Edition (SCIM, audit logs, compliance dashboards) requires a licence and contact-sales pricing
- SMS alerts cost $0.10 per SMS and phone call alerts cost $0.10 per minute, and these add up in high-volume on-call environments
- The Docker Compose install asks for a Linux server with at least 8 GB of memory. The Kubernetes Helm chart route is also available
License & Hosting
- License: Apache-2.0 for all code outside the
ee/directory. Theee/directory is under the OneUptime Enterprise License. The Community Edition image contains no code fromee/. - Where it runs: self-hosted via Docker Compose (one Linux server, 8 GB memory minimum) or Kubernetes Helm chart. Air-gapped deployment supported
- Costs: community edition costs only infrastructure. Growth plan from $20/user/month (annual). Active monitoring from $1/monitor/month. Telemetry ingest at $0.10/GB. SMS/call alerts at $0.10 per SMS or per minute
Best For
I'd reach for OneUptime when the team needs uptime monitoring, on-call and incident management alongside logs and traces, all in one self-hosted product, especially in air-gapped or compliance-restricted environments. Running a status page tool and an observability backend as separate products means separate integration surfaces to maintain and separate bills to reconcile. Teams whose primary need is APM with deep trace analysis will be better served by SigNoz.

- 6.6K stars
- AGPL-3.0
- Active this week
- Last commit 2 days ago
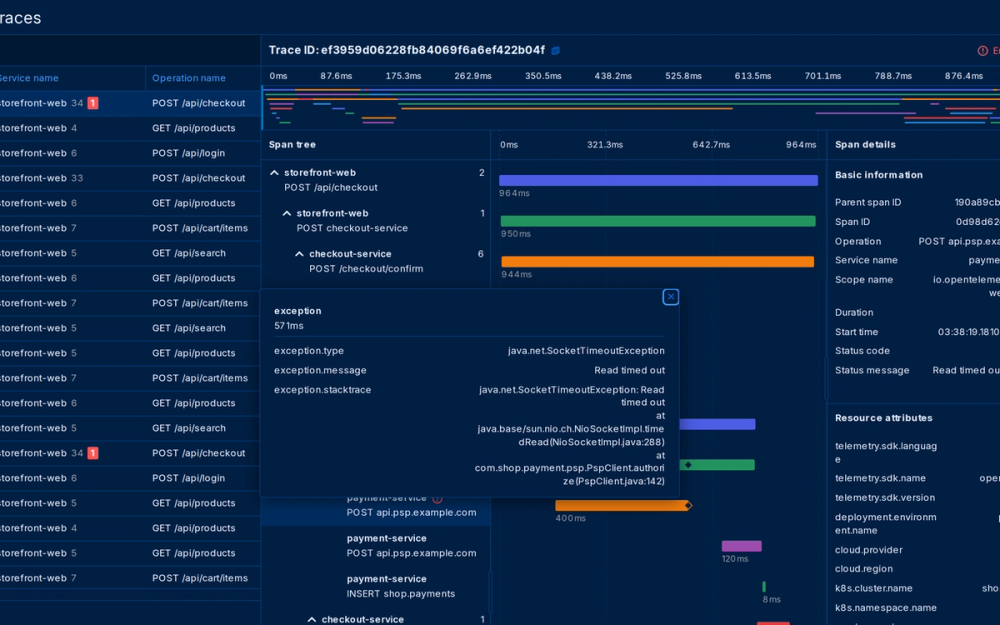
Zabbix has no paid edition of the monitoring software. The software is free under AGPL-3.0 from version 7.0, and GPLv2 for all versions up to 6.4. Zabbix sells support and Zabbix Cloud, but the monitoring software itself carries no licence cost.
Read moreShow lessKey Features · Pros · Cons · License & Hosting · Best For
Zabbix collects metrics, logs, traces, and events from a long source list: OpenTelemetry, network devices, cloud services, containers, virtual machines, OS-level monitoring, log files, databases, IoT sensors, and HTTP/HTTPS endpoints. Multi-cloud cost dashboards for AWS, Azure, Google Cloud, and Oracle Cloud ship out of the box. Monitoring templates cover OpenAI Platform, Claude API, OpenRouter, GitHub Copilot, and Microsoft 365 Copilot.
Key Features
- Metrics, logs, traces, and events in one platform with event correlation, automated alerting, and remediation
- OpenTelemetry APM support for following requests across services
- Unlimited proxies for monitoring thousands of remote locations, branches, and data centers
- Business service SLA monitoring with service trees, outage simulation, and multiple status calculation algorithms
- MCP server for AI-assisted investigation and monitoring workflow automation
- Free mobile app for iOS and Android with push notifications
Pros
- The monitoring software is free under AGPL-3.0 with no paid edition: the only mandatory ongoing cost is infrastructure
- Scalable via unlimited proxy deployments across any number of remote locations
- Multi-tenancy with flexible role and permission isolation per customer, which matters for MSPs
Cons
- AGPL-3.0 applies from version 7.0: teams building a managed network monitoring service on Zabbix must make modified source available, and network-service providers should review this before deploying
- The Zabbix server requires UNIX and does not run as a server on Windows
- The UI and configuration model have a steeper learning curve than the more modern tools on this list
- OpenTelemetry is supported for APM, but tracing is not the primary focus of the product
License & Hosting
- License: AGPL-3.0 from version 7.0, GPLv2 for versions up to 6.4. The AGPL terms are the same as Grafana's (see How to choose).
- Where it runs: self-hosted on-premises or in the cloud using official packages, Docker containers, cloud images, or a pre-configured VM appliance. Zabbix Cloud is available with a 5-day free trial.
- Setup: UNIX server required. Docker, cloud image, and VM appliance installs are available. The Zabbix server does not run on Windows.
- Costs: the monitoring software is free. Zabbix sells technical support and Zabbix Cloud. Infrastructure is the only mandatory ongoing cost
Best For
I'd pick Zabbix when the primary need is infrastructure and network device monitoring across a large mixed fleet, with multi-cloud cost dashboards and no licence cost for the monitoring software. The unlimited proxy model suits distributed or multi-site environments well. For deep APM trace analysis, SigNoz is the better tool for that job.
Decision framework
How to choose
Use this section to narrow the Datadog replacement by team size, hosting model, license, and migration difficulty.
Before picking one, 4 things decide whether it fits: which signal types it covers natively, what the licence lets you do commercially, what the deployment depends on, and what storage and compute actually cost at your data volumes.
4 of these tools are AGPL-3.0 (Grafana, OpenObserve, Uptrace, Zabbix): running them for your own team asks nothing of you. If you change the code and offer it to others over a network, you share your changes. Apache-2.0 and MIT carry no such condition. Netdata is not ranked here because only its agent is open source (GPL v3+), and its dashboard is under the closed Netdata Cloud UI License.
Datadog supports OpenTelemetry, so apps instrumented with it can send to another backend, and SigNoz documents a Datadog Receiver for the move.
3 questions decide it: what your primary signal is, whether the fleet is Kubernetes-first, and whether the team is happy operating one binary or comfortable running multiple services.
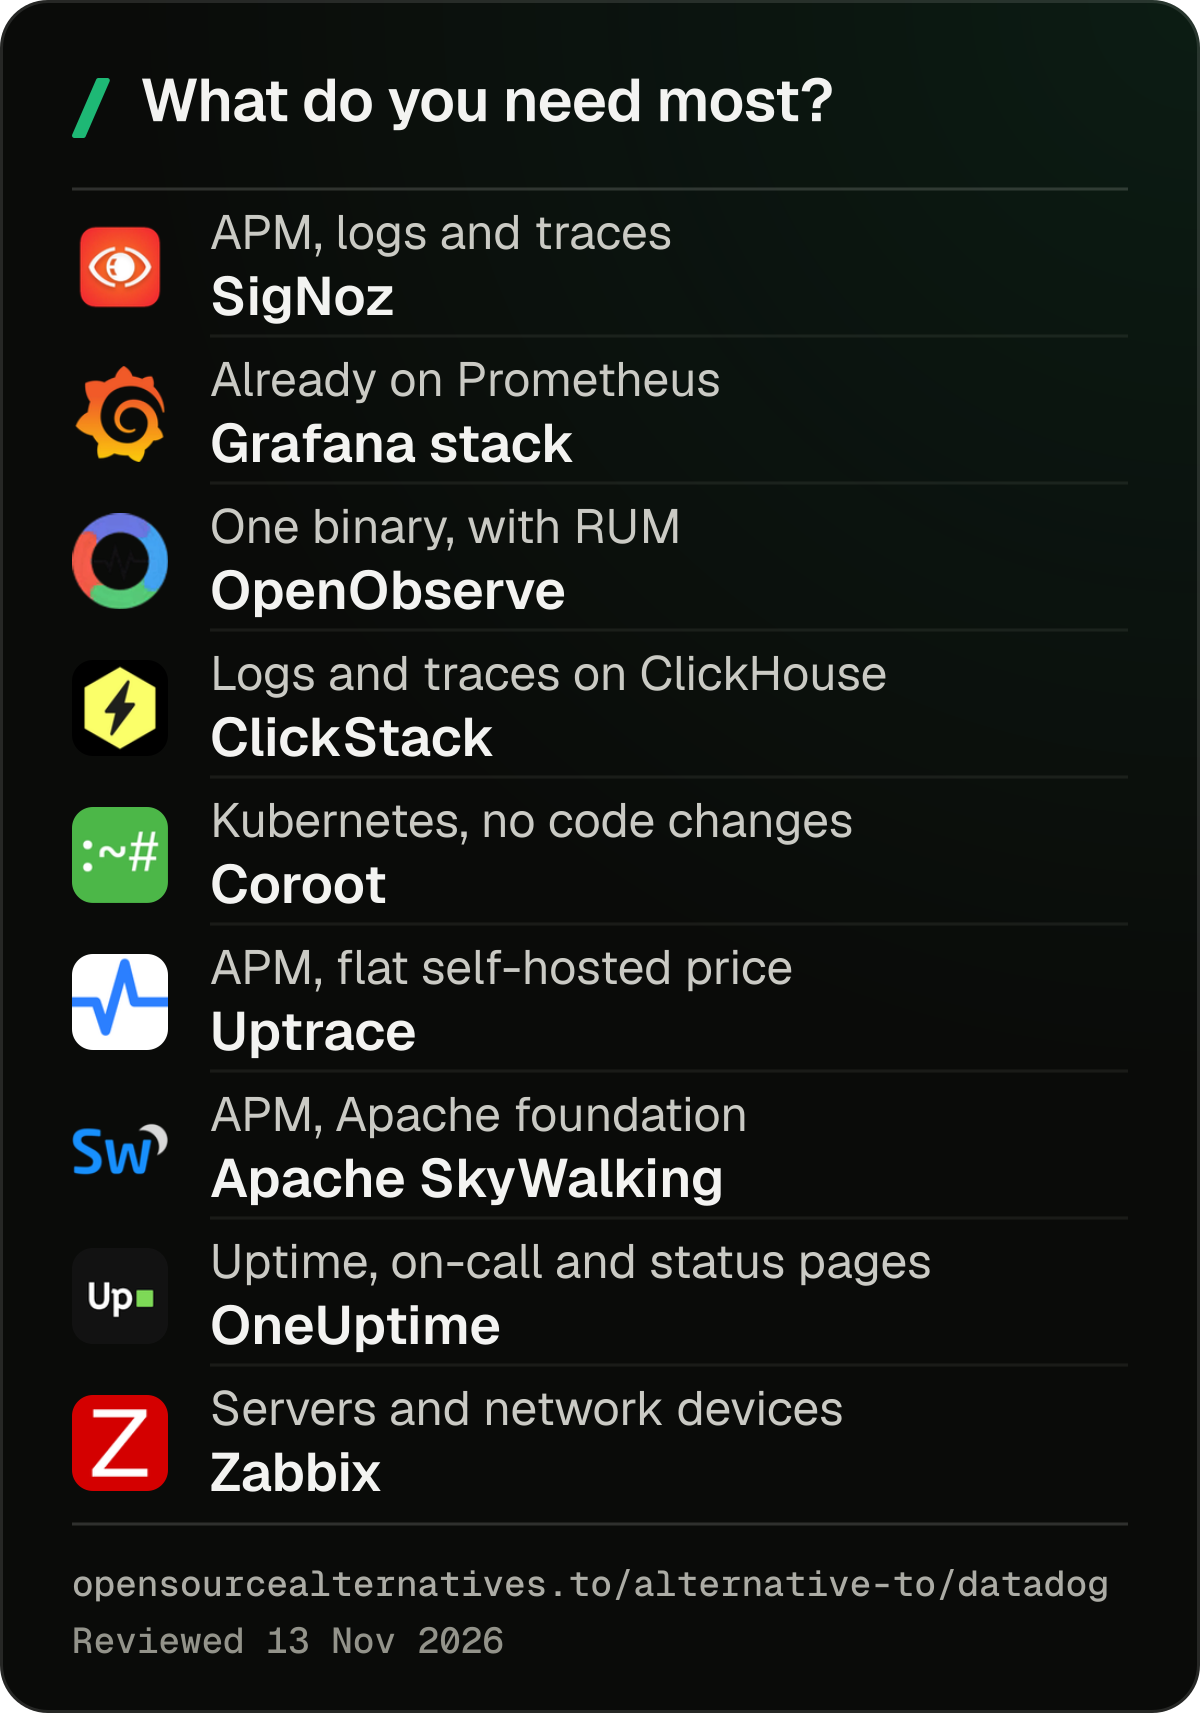
If APM traces are the primary signal and the fleet is Kubernetes-first with eBPF available, I'd start with Coroot: it uses eBPF to capture telemetry with no code changes, and its Standard plan includes SLO tracking. If APM traces are the need but eBPF is not available or the fleet is mixed, SigNoz is the pick.
If the primary need is infrastructure metrics and the team already runs Prometheus on Kubernetes, the Grafana stack extends what is already in place. If the fleet is network-heavy or multi-cloud with no existing Prometheus, Zabbix collects from network devices, cloud services, and containers with no licence cost for the software.
If uptime, on-call, and incident management are the primary need, OneUptime covers those jobs plus OpenTelemetry telemetry in one product. Teams that want fewer moving parts than the Grafana multi-service stack can cover infrastructure metrics with SigNoz too.
Complete directory list
All alternatives to Datadog

Alternative to UptimeRobot
Track uptime for websites and APIs with 90+ alert integrations
- 93,471 GitHub stars
- Licence MIT
- #Monitoring

Alternative to Datadog
Real-time infrastructure monitoring with zero configuration
- 81,355 GitHub stars
- Licence GPL-3.0
- #Monitoring

Alternative toDatadog
Open source dashboards for metrics, logs, and traces
- 77,876 GitHub stars
- Licence AGPL-3.0
- #Monitoring

Alternative toDatadog
Time series monitoring with a dimensional model and PromQL query language.
- 67,616 GitHub stars
- Licence Apache-2.0
- #Monitoring

Alternative to Rollbar
Real-time error tracking with performance monitoring and traces
- 45,767 GitHub stars
- Licence FSL-1.1-Apache-2.0

Alternative toDatadog
OpenTelemetry-native APM with logs, traces, metrics, and self-hosting.
- 32,588 GitHub stars
- Licence MIT

Alternative toDatadog
Self-hosted server monitoring with Docker stats and disk health.
- 27,156 GitHub stars
- Licence MIT
- #Monitoring

Alternative toDatadog
APM platform covering traces, metrics, logs, and AI agent monitoring.
- 25,004 GitHub stars
- Licence Apache-2.0

Alternative toDatadog
Self-hosted observability for logs, metrics, and traces
- 22,985 GitHub stars
- Licence AGPL-3.0

Alternative to Grafana Cloud
High-performance self-hosted time series database and metrics
- 18,089 GitHub stars
- Licence Apache-2.0
- #Database

Alternative toDatadog
Self-hosted observability stack on ClickHouse with session replay
- 10,031 GitHub stars
- Licence MIT

Alternative toDatadog
Instant observability with no-code setup.
- 8,009 GitHub stars
- Licence Apache-2.0

Alternative toDatadog
Uptime, on-call, incidents, logs, and traces; one open source product.
- 7,809 GitHub stars
- Licence Apache-2.0
- #Monitoring

Alternative toDatadog
Self-hosted enterprise monitoring with agent and agentless collection.
- 6,557 GitHub stars
- Licence AGPL-3.0
- #Monitoring
Migration
Migration notes for leaving Datadog
Move one signal type at a time, and keep both Datadog and the new backend running in parallel until the replacement is verified. That is the migration that does not break in production.
OpenTelemetry is the common path. Datadog's own docs show the full setup: Datadog supports sending OpenTelemetry data through the OpenTelemetry Collector or the Datadog Agent.
If your team is still on the Datadog Agent, SigNoz includes a Datadog Receiver in the OpenTelemetry Collector. The Agent keeps running and forwarding traffic to the Collector, which forwards it to SigNoz, so no application changes are required to get started. SigNoz's migration path then swaps the Datadog agents and libraries for OTel instrumentation one signal type at a time, with both platforms running until you're done.
For Kubernetes teams that haven't instrumented anything yet, Coroot's eBPF approach means the migration step is deploying the Coroot agent, not re-instrumenting services. For infrastructure and network-heavy setups, Zabbix supports OpenTelemetry for APM alongside its native agent and agentless collection, so the OTel path is available there too.
Teams not already on OTel will spend engineering time on instrumentation, and that is the real cost. Apache SkyWalking provides auto-instrument agents for Java, C#, Node.js, Go, PHP and Python, which covers the most common server-side languages.
FAQ
Datadog alternatives FAQ
Is there an open source alternative to Datadog?
Yes. SigNoz covers APM, logs, traces, and infrastructure monitoring in one open source product with no per-host fees. Coroot handles Kubernetes with eBPF auto-discovery. OpenObserve runs logs, metrics, and traces in a single binary. Zabbix covers infrastructure and network monitoring under AGPL-3.0 with no licence cost for the software. Uptrace is an OpenTelemetry APM tool with a community edition that starts at $0.
Is there a free version of Datadog?
Yes. Datadog's free tier covers up to 5 Basic hosts with 1-day metric retention at no cost. Paid plans start at $15 per host per month for Infrastructure Pro (billed annually) plus $31 per APM host. SigNoz's community edition is free and runs on your own infrastructure. Uptrace's community edition is $0 forever.
Why is Grafana better than Datadog?
Grafana's OSS stack carries no per-host fee, and Prometheus is Apache-2.0 and free to self-host. At Datadog's Infrastructure Pro rate of $15 per host per month billed annually, plus $31 for APM, a 20-host team with APM on every host pays $920 a month before logs. The trade is operating Prometheus, Loki, Tempo, and Grafana yourself, while Datadog runs as managed SaaS with nothing to maintain on your end. I'd say Grafana wins for teams already on Prometheus and Kubernetes, where the ecosystem has real breadth. For teams without that operational capacity, Datadog is the cleaner option.
Which open source tool covers Kubernetes with eBPF auto-discovery?
Coroot. It uses eBPF to capture metrics, logs, traces, and profiles with zero code changes, and deploys as a Kubernetes agent, Kubernetes Operator, on OpenShift, Docker, and others. The minimum Linux kernel version is 4.16, and Docker-in-Docker environments such as MiniKube are not supported. The community edition is free on GitHub.
How do I migrate from Datadog to an open source observability tool?
I'd do it incrementally. SigNoz ships a Datadog Receiver in the OpenTelemetry Collector as a bridge, so the Datadog Agent keeps running and forwarding traffic while you add OTel instrumentation service by service. Datadog supports sending OpenTelemetry data through the OpenTelemetry Collector or the Datadog Agent, so instrumentation written for the OTel standard can later point at an open source backend. Migrate one signal type at a time, traces first, then logs, then metrics, run both platforms in parallel until the new one is verified, and keep the Datadog subscription until the replacement runs the job reliably.
What is the cheapest open source Datadog alternative for log management?
Datadog log ingestion costs $0.10 per GB on all billing cycles before indexing and retention charges. The self-hosted open source editions of SigNoz, OpenObserve and Uptrace are free to run, so the cost there is only the VPS or cluster. For hosted options: SigNoz Cloud logs cost $0.30 per GB ingested with no per-host fee. OpenObserve Cloud Professional charges $0.50 per GB ingested with annual commitment. HyperDX Starter covers 50 GB for $20/month flat. Self-hosting carries compute and storage costs the per-GB number does not include, so factor in the machine before comparing against cloud pricing.

By category
Open source tools in these categories


DevOps & CI/CD
Nvm, Uptime Kuma, Netdata191


Security & Monitoring
REA (Reverse Engineer Anything), RustDesk, Sherlock158

IT Management
RustDesk, Immich, Stirling PDF119


Data & Analytics
Firecrawl, ragflow, Worldmonitor635


Developer Tools
Skills for Real Engineers, REA (Reverse Engineer Anything), superpowers530

AI & Machine Learning
freeCodeCamp, REA (Reverse Engineer Anything), OpenClawKeep reading
Related articles
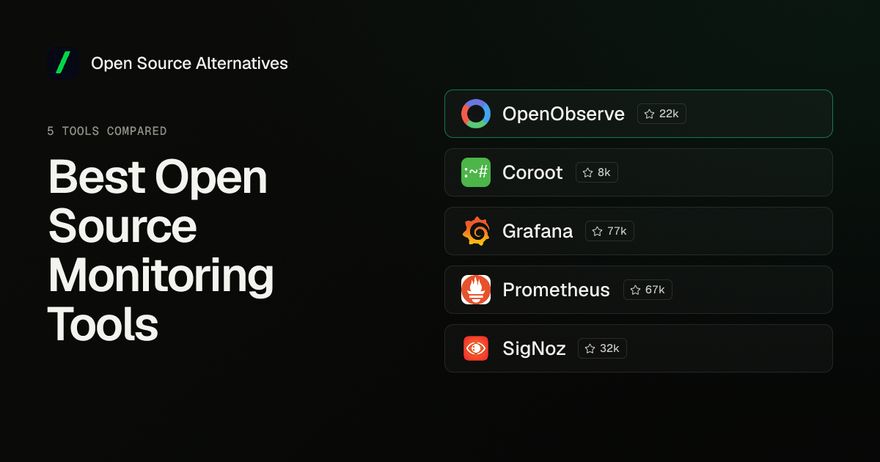
Best Open Source Monitoring Tools in 2026
Datadog costs $15/host/month and reaches $60K/year at 50 nodes. These open source monitoring tools give you metrics, logs, and traces, with no per-host pricing.
Best Self-Hosted Apps in 2026
SaaS subscriptions compound fast. These 8 open source self-hosted apps replace Notion, Datadog, Zapier, and Airtable for the cost of a single $12/month VPS.
Prometheus vs Grafana: Which One Do You Actually Need (and Do You Need Both)?
Prometheus collects metrics. Grafana visualizes them. Not competitors: here is what each does, why most stacks use both, and when simpler is the right call.


