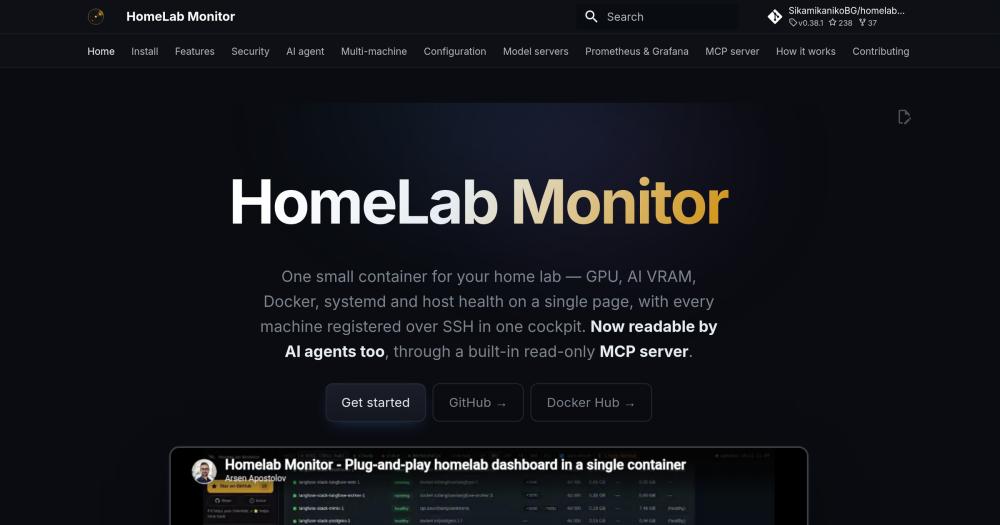
HomeLab Monitor vs Netdata
Both tools provide per-host system metrics with a browser-based dashboard, but they target different scopes. Netdata is a mature general-purpose monitoring agent with per-second visibility into Linux performance. HomeLab Monitor is a newer tool focused on the homelab use case, particularly for hosts running local AI workloads and GPU-intensive tasks.
| Feature | HomeLab Monitor | Netdata |
|---|
| License | MIT | GPL v3 (agent), Netdata Cloud proprietary |
| Self-hosting | Single container, no agent on remotes | Per-host agent required on each machine |
| GPU monitoring | VRAM attributed per model and process | GPU metrics via plugin; no model server awareness |
| Local AI model tracking | Yes: Ollama, vLLM, llama.cpp, 30+ servers | No |
| Multi-machine setup | Agentless over SSH | Per-host agent and parent node or Netdata Cloud |
| Energy cost tracking | Per process, per model, with tariff support | Power metrics; no cost accounting |
| MCP/AI agent | Built-in read-only MCP server and built-in agent | No |
| External stack needed | None | Optional Prometheus/Grafana integration |
HomeLab Monitor is the better fit when local AI workloads are the reason for monitoring. The VRAM attribution by model server, energy cost per process, Benchmark Lab, and built-in MCP server are features Netdata does not address. For a fleet of a few machines where the central question is what your Ollama or vLLM instance is doing, HomeLab Monitor answers that directly without a separate agent on each host.
Netdata is worth choosing when you need broad, per-second Linux performance visibility across many hosts, mature alerting pipelines, Kubernetes support, or integration into an existing observability stack. Its agent ecosystem covers hundreds of application and service integrations that HomeLab Monitor does not attempt. For general infrastructure monitoring with no GPU workloads, Netdata is the more proven choice.